CRAN maintained packages
The role of package managers in software is paramount for developers. In R the CRAN team provides a platform to tests and host packages. This means ensuring that R dependencies are up to date and software required by some packages are also available in CRAN.
This helps testing ~20000 packages frequently (daily for most packages) in several architectures and R versions. In addition, they test updates for compatibility with the dependencies and test and review new packages.
Most of the work with packages is automated but often requires human intervention (50% of the submisions). Another consuming activity is keeping up packages abandoned by their original maintainers.
While newer packages are archived from CRAN often, some old packages were adopted by CRAN. The CRAN team is looking for help maintining those.
In this post I’ll explore the packages maintained by CRAN.
CRAN in packages
packages_db <- as.data.frame(tools::CRAN_package_db())
cran_author <- grep("CRAN Team", x = packages_db$Author, ignore.case = TRUE)
cran_authorsR <- grep("CRAN Team", x = packages_db$`Authors@R`, ignore.case = TRUE)
CRAN_TEAM_mentioned <- union(cran_author, cran_authorsR)
unique(packages_db$Package[CRAN_TEAM_mentioned])
## [1] "fBasics"   "fMultivar" "geiger"    "plotrix"   "RCurl"     "RJSONIO"
## [7] "udunits2"  "XML"
In some of these package the CRAN team appears as contributors because they provided help/code to fix bugs:
In others they are the maintainers:
From these three packages RJSONIO is the newest (first release in 2010) and requires less updates (lately 1 or 2 a year). However, in 2022 RCurl and XML required 4 and 5 updates respectively. I will focus on these packages as these are the ones they are looking for new maintainers.
RCurl and XML
Circular dependency
Both XML and RCurl depend on each other.
We can see that the packages are direct dependencies of one of their direct dependencies! How can be that? If we go the the RCurl website we see in “Suggests: XML”, and in the XML website the RCurl is there too. This circular dependency is allowed because they have each other in Suggests.
A first step to reduce any possible problem would be to separate them. This would make it easier understanding which package is worth prioritizing and possible missteps will have less impact.
If we look at XML source code for RCurl we find some code in inst/ folder.
If these two cases were removed the package could remove its dependency to RCurl.
Similarly, if we look at RCurl source code for XML we find some code in inst/ folder and in some examples.
If these three cases were removed the package could remove its dependency to XML.
RCurl has been more stable than XML, which have seen new functions added and one removed since CRAN is maintaining it.
Relevant data
We will look at 4 sets of data for each pacakge: dependencies, releases, maintainers and downloads.
Dependencies
Both packages have some system dependencies which might make the maintenance harder. In addition they have a large number of dependencies. We can gather the dependencies in CRAN and Bioconductor software packages:
library("tools")
# Look up only software dependencies in Bioconductor
options(repos = BiocManager::repositories()[c("BioCsoft", "CRAN")])
ap <- available.packages()
all_deps <- package_dependencies(c("RCurl", "XML"),
                                 reverse = TRUE, db = ap, which = "all")
all_unique_deps <- unique(unlist(all_deps, FALSE, FALSE))
first_deps <- package_dependencies(all_unique_deps, db = ap, which = "all")
first_deps_strong <- package_dependencies(all_unique_deps, db = ap, which = "strong")
strong <- sapply(first_deps_strong, function(x){any(c("XML", "RCurl") %in% x)})
deps_strong <- package_dependencies(all_unique_deps, recursive = TRUE,
                                 db = ap, which = "strong")
first_rdeps <- package_dependencies(all_unique_deps,
                                   reverse = TRUE, db = ap, which = "all")
deps_all <- package_dependencies(all_unique_deps, recursive = TRUE,
                                 db = ap, which = "all")
They have 495 direct dependencies (and 8 more in annotation packages in Bioconductor: recount3, ENCODExplorerData, UCSCRepeatMasker, gDNAinRNAseqData, qdap, qdapTools, metaboliteIDmapping and curatedBreastData).
These two packages with their dependencies are used one way or another by around 20000 packages (about 90% of CRAN and Bioconductor)! If these packages fail the impact on the community will be huge.
To reduce the impact of the dependencies we should look up the direct dependencies. But we also looked at the reverse dependencies to asses the impact of the package in the other packages.
Know which are these, and who maintain them will help decide what is the best course of action.
Releases
A first approach is looking into the number of releases and dates to asses if the package has an active maintainer or not:
archive <- tools:::CRAN_archive_db()[all_unique_deps]
packages <- tools::CRAN_package_db()
library("dplyr")
library("BiocPkgTools")
fr <- vapply(archive, function(x) {
  if (is.null(x)) {
    return(NA)
  }
  as.Date(x$mtime[1])
}, FUN.VALUE = Sys.Date())
fr_bioc <- biocDownloadStats("software") |>
  filter(Package %in% all_unique_deps) |>
  firstInBioc() |>
  pull(Date, name = Package)
first_release <- c(as.Date(fr[!is.na(fr)]), as.Date(fr_bioc))[all_unique_deps]
last_update <- packages$Published[match(all_unique_deps, packages$Package)]
releases <- vapply(archive, NROW, numeric(1L)) + 1
We only have information about CRAN packages:
Bioconductor has two releases every year, and while the maintainers can release patched versions of packages between them that information is not stored (or easily retrieved, they are still available in the git server).
Even if Bioconductor maintainers didn’t modify the package the version number increases with each release. But the version update in the git doesn’t propagate to users automatically unless their checks pass. For all these reasons it doesn’t make sense to count releases of packages in Bioconductor.
Maintainers
Now that we know which packages are more active, we can look up for the people behind it. This way we can prioritize working with maintainers that are known to be active1.
maintainers <- packages_db$Maintainer[match(all_unique_deps, packages_db$Package)]
maintainers <- trimws(gsub("<.+>", "", maintainers))
Once again, the Bioconductor repository doesn’t provide a file to gather this kind of data.
Downloads
Another variable we can use are the downloads from users of said packages. Probably, packages more downloaded are used more and a breaking change on them will have impact on more people than other packages.
library("cranlogs")
acd <- cran_downloads(intersect(all_unique_deps, packages_db$Package),
                          when = "last-month")
cran_pkg <- summarise(acd, downloads = sum(count), .by = package)
loc <- Sys.setlocale(locale = "C")
bioc_d <- vapply(setdiff(all_unique_deps, packages_db$Package), function(x){
  pkg <- pkgDownloadStats(x)
  tail(pkg$Nb_of_downloads, 1)
  }, numeric(1L))
bioc_pkg <- data.frame(package = names(bioc_d), downloads = bioc_d)
downloads <- rbind(bioc_pkg, cran_pkg)
rownames(downloads) <- downloads$package
dwn <- downloads[all_unique_deps, ]
The logs are provided by the global mirror of CRAN (sponsored by Rstudio).
The Bioconductor infrastructure which provides total number of downloads and number of downloads from distinct IPs 2.
Analysis
We collected the data that might be relevant. Now, we can start looking all the data gathered:
repo <- vector("character", length(all_unique_deps))
ap_deps <- ap[all_unique_deps, ]
repo[startsWith(ap_deps[, "Repository"], "https://bioc")] <- "Bioconductor"
repo[!startsWith(ap_deps[, "Repository"], "https://bioc")] <- "CRAN"
deps <- data.frame(package = all_unique_deps,
                   direct_dep_XML = all_unique_deps %in% all_deps$XML,
                   direct_dep_RCurl = all_unique_deps %in% all_deps$RCurl,
                   first_deps_n = lengths(first_deps),
                   deps_all_n = lengths(deps_all),
                   first_rdeps_n = lengths(first_rdeps),
                   first_deps_strong_n = lengths(first_deps_strong),
                   deps_strong_n = lengths(deps_strong),
                   direct_strong = strong,
                   releases = releases,
                   strong = strong,
                   first_release = first_release,
                   last_release = last_update,
                   maintainer = maintainers,
                   downloads = dwn$downloads,
                   repository = repo) |>
  mutate(type = case_when(direct_dep_XML & direct_dep_RCurl ~ "both",
                          direct_dep_XML ~ "XML",
                          direct_dep_RCurl ~ "RCurl"))
rownames(deps) <- NULL
head(deps)| package | direct_dep_XML | direct_dep_RCurl | first_deps_n | deps_all_n | first_rdeps_n | first_deps_strong_n | deps_strong_n | direct_strong | releases | strong | first_release | last_release | maintainer | downloads | repository | type |
|---|---|---|---|---|---|---|---|---|---|---|---|---|---|---|---|---|
| AnnotationForge | TRUE | TRUE | 26 | 2456 | 5 | 10 | 47 | TRUE | 1 | TRUE | 2012-02-01 | NA | NA | 8113 | Bioconductor | both |
| AnnotationHubData | TRUE | TRUE | 33 | 2456 | 4 | 26 | 136 | TRUE | 1 | TRUE | 2015-02-01 | NA | NA | 6619 | Bioconductor | both |
| autonomics | FALSE | TRUE | 61 | 2499 | 0 | 34 | 104 | FALSE | 1 | FALSE | 2021-02-01 | NA | NA | 91 | Bioconductor | RCurl |
| BaseSpaceR | FALSE | TRUE | 6 | 2456 | 0 | 3 | 4 | TRUE | 1 | TRUE | 2013-02-01 | NA | NA | 218 | Bioconductor | RCurl |
| BayesSpace | FALSE | TRUE | 34 | 2459 | 0 | 24 | 161 | TRUE | 1 | TRUE | 2020-02-01 | NA | NA | 221 | Bioconductor | RCurl |
| BgeeDB | FALSE | TRUE | 19 | 2457 | 2 | 14 | 71 | TRUE | 1 | TRUE | 2016-02-01 | NA | NA | 238 | Bioconductor | RCurl |
I added some numbers and logical values that might help exploring this data.
We will look at the packages dependencies between RCurl and XML, some plots to have a quick view
Distribution dependencies
Let’s see how many packages depend in each of them:
deps |>
  summarise(Packages = n(), deps = sum(first_deps_n),
            q25 = quantile(deps_all_n, probs = 0.25),
            mean_all = mean(deps_all_n),
            q75 = quantile(deps_all_n, probs = 0.75),
            .by = c(direct_dep_XML, direct_dep_RCurl)) |>
arrange(-Packages)| direct_dep_XML | direct_dep_RCurl | Packages | deps | q25 | mean_all | q75 |
|---|---|---|---|---|---|---|
| TRUE | FALSE | 235 | 3584 | 2456 | 2365.596 | 2458.5 |
| FALSE | TRUE | 193 | 3187 | 2456 | 2320.855 | 2460.0 |
| TRUE | TRUE | 67 | 1216 | 2456 | 2423.119 | 2457.5 |
There are ~40 more packages depending on XML than to RCurl and just 67 to both of them.
Overview
We can plot some variables to get a quick overview of the packages:
library("ggplot2")
library("ggrepel")
deps_wo <- filter(deps, !package %in% c("XML", "RCurl"))
deps_wo |>
  ggplot() +
  geom_point(aes(first_deps_n, downloads, shape = type)) +
  geom_text_repel(aes(first_deps_n, downloads, label = package),
                  data = filter(deps_wo, first_deps_n > 40 | downloads > 10^5)) +
  theme_minimal() +
  scale_y_log10(labels = scales::label_log()) +
  labs(title = "Packages and downloads",
       x = "Direct dependencies", y = "Downloads", size = "Packages")
## Warning: ggrepel: 1 unlabeled data points (too many overlaps). Consider
## increasing max.overlaps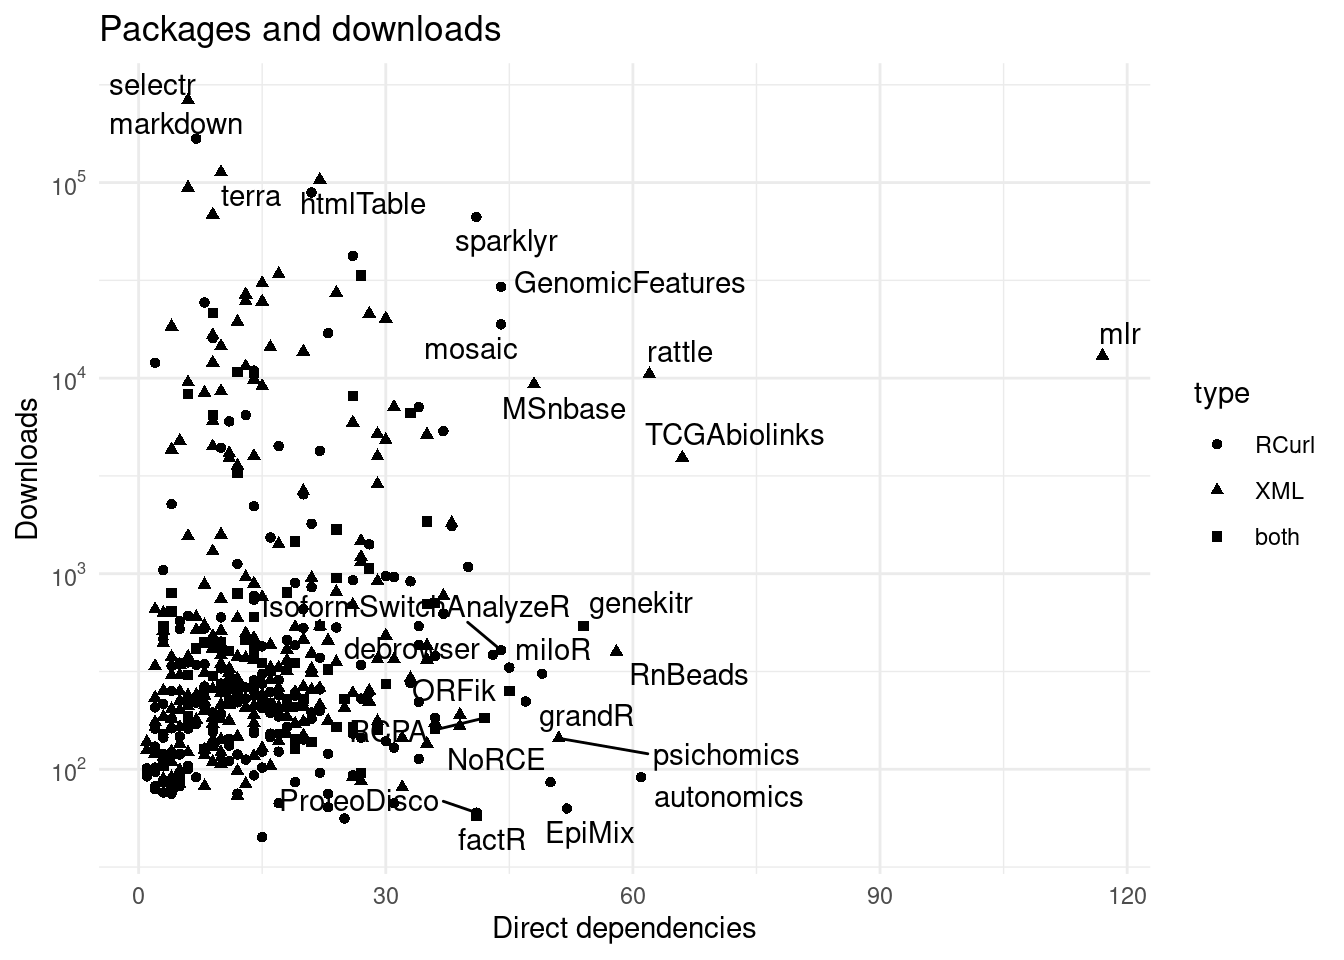
Figure 1: Direct dependencies vs downloads. Many pakcages have up to 50 packages and most have below 1000 downloads in a month.
There is an outlier on 1, the mlr package has more than 10k downloads and close to 120 direct dependencies, but down to less than 15 strong dependencies !
deps_wo |>
  ggplot() +
  geom_point(aes(first_deps_n, first_rdeps_n, shape = type)) +
  geom_text_repel(aes(first_deps_n, first_rdeps_n, label = package),
                  data = filter(deps_wo, first_deps_n > 60 | first_rdeps_n > 50)) +
  theme_minimal() +
  scale_y_log10(labels = scales::label_log()) +
  labs(title = "Few dependencies but lots of dependents",
    x = "Direct dependencies", y = "Depend on them", size = "Packages")
## Warning: Transformation introduced infinite values in continuous y-axis
## Transformation introduced infinite values in continuous y-axis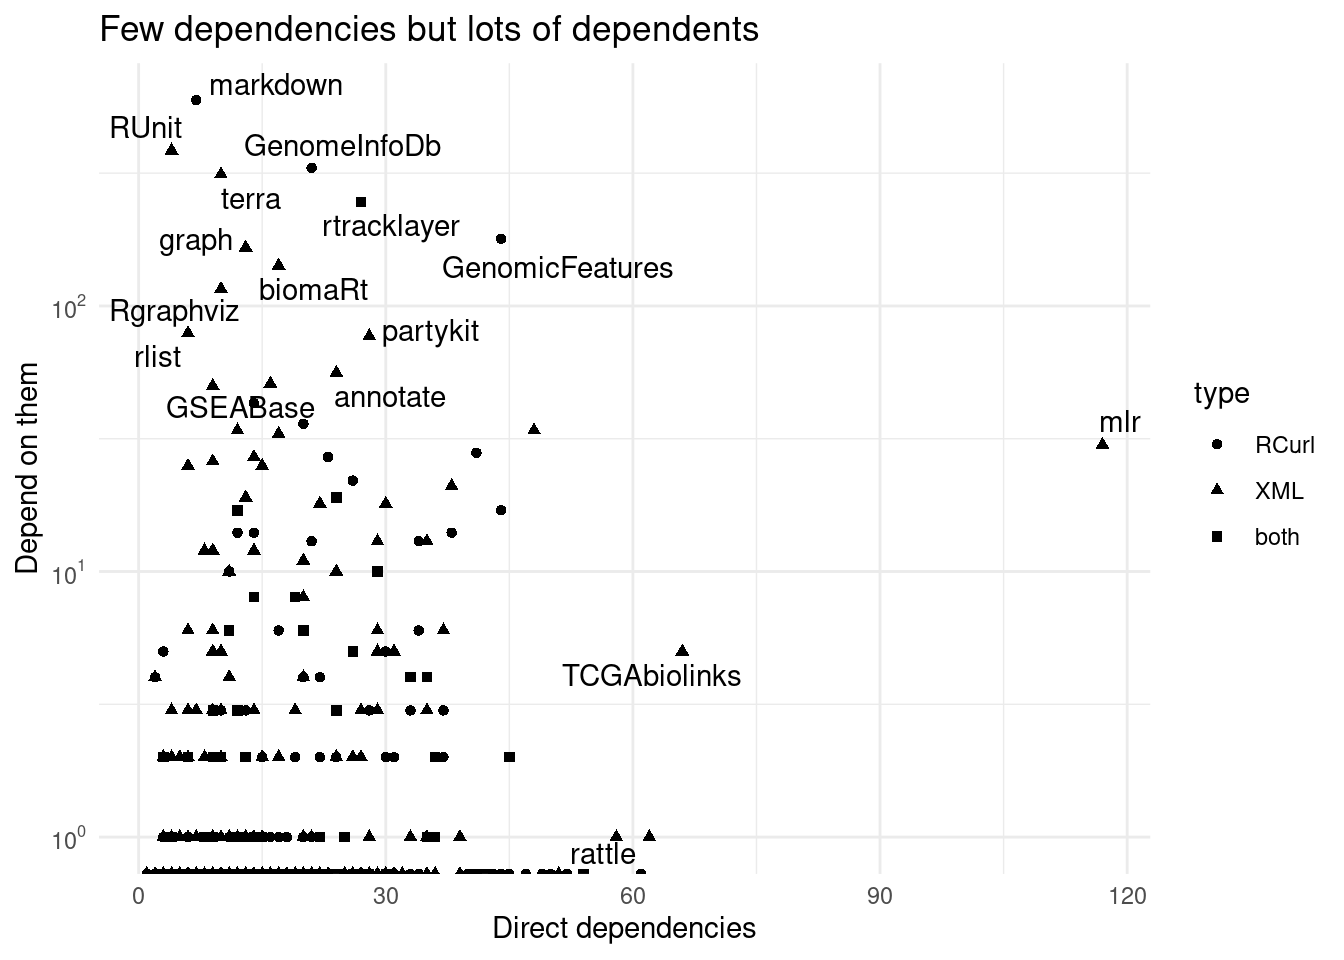
Figure 2: Dependencies vs packages that depend on them.
In general though, the packages that have more dependencies have less direct dependencies.
library("ggplot2")
library("ggrepel")
deps_wo <- filter(deps, !package %in% c("XML", "RCurl"))
deps_wo |>
  ggplot() +
  geom_vline(xintercept = 20, linetype = 2) +
  geom_point(aes(first_deps_strong_n, downloads, shape = repository)) +
  geom_text_repel(aes(first_deps_strong_n, downloads, label = package),
                  data = filter(deps_wo, first_deps_strong_n > 20 | downloads > 10^5)) +
  theme_minimal() +
  scale_y_log10(labels = scales::label_log()) +
  labs(title = "Packages and downloads",
       x = "Direct strong dependencies", y = "Downloads", shape = "Repository")
## Warning: ggrepel: 20 unlabeled data points (too many overlaps). Consider
## increasing max.overlaps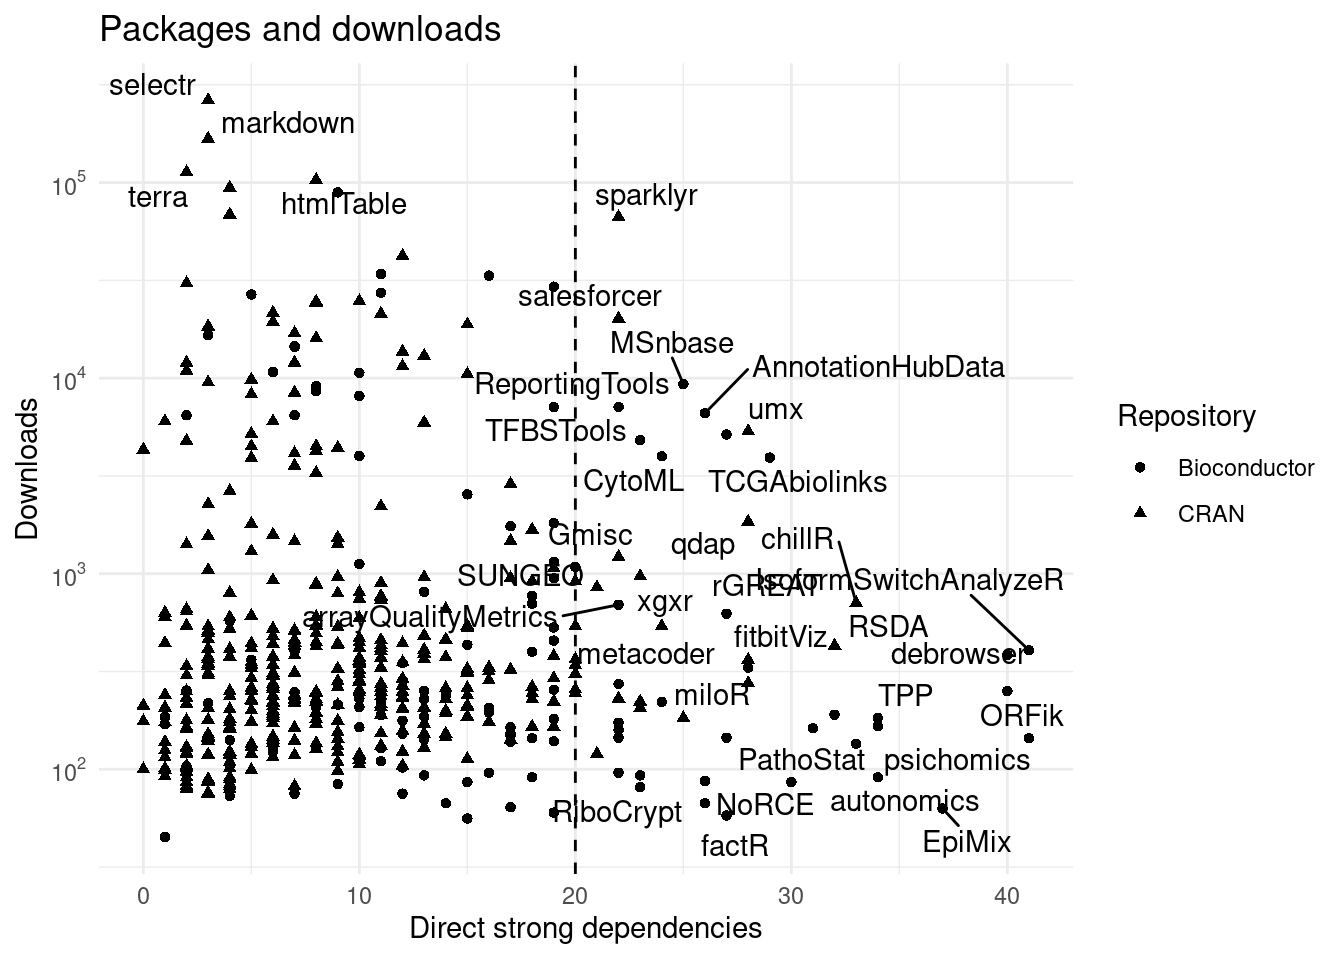
Figure 3: Direct strong dependencies vs downloads. Many pakcages have more than 20 direct imports.
One observable effect is that many packages do not comply with current CRAN rules of having 20 strong dependencies (as described in R-internals). This suggests that these CRAN packages are old or that this limit is not checked in packages updates.
data_maintainers <- deps_wo |>
  filter(!is.na(maintainer)) |>
  summarize(n = n(), downloads = sum(downloads), .by = maintainer)
data_maintainers |>
  ggplot() +
  geom_point(aes(n, downloads)) +
  geom_text_repel(aes(n, downloads, label = maintainer),
                  data = filter(data_maintainers, n > 2 | downloads > 10^4)) +
  scale_y_log10(labels = scales::label_log()) +
  scale_x_continuous(breaks = 1:10, minor_breaks = NULL) +
  theme_minimal() +
  labs(title = "CRAN maintainers that depend on XML and RCurl",
       x = "Packages", y = "Downloads")
## Warning: ggrepel: 15 unlabeled data points (too many overlaps). Consider
## increasing max.overlaps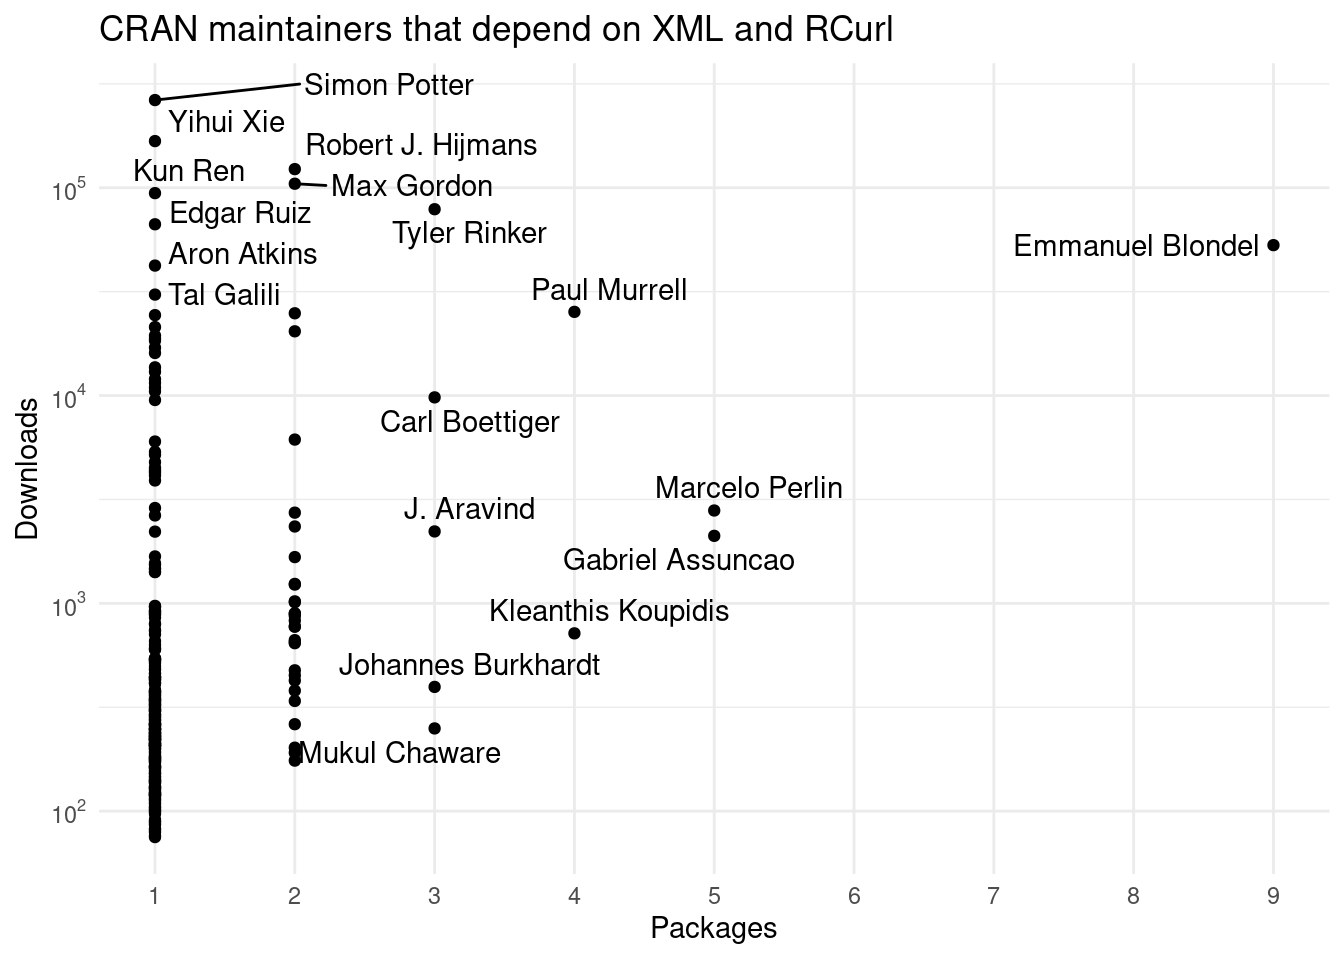
Figure 4: Looking at maintainers and the number of downloads they have.
Most maintainer have few packages, some highly used packages but some have many packages relatively highly used.
Finding important packages
We can use a PCA to find which packages are more important.
cols_pca <-  c(4:7, 15)
pca_all <- prcomp(deps_wo[, cols_pca], scale. = TRUE, center = TRUE)
summary(pca_all)
## Importance of components:
##                          PC1    PC2    PC3     PC4     PC5
## Standard deviation     1.386 1.2478 0.9458 0.65380 0.44846
## Proportion of Variance 0.384 0.3114 0.1789 0.08549 0.04022
## Cumulative Proportion  0.384 0.6954 0.8743 0.95978 1.00000
pca_data <- cbind(pca_all$x, deps_wo)
ggplot(pca_data) +
  geom_hline(yintercept = 0) +
  geom_vline(xintercept = 0) +
  geom_point(aes(PC1, PC2, col = repository, shape = repository)) +
  geom_text_repel(aes(PC1, PC2, label = package),
                  data = filter(pca_data, abs(PC1) > 2 | abs(PC2) > 2)) +
  theme_minimal() +
  theme(axis.text = element_blank()) +
  labs(title = "PCA of the numeric variables")
## Warning: ggrepel: 58 unlabeled data points (too many overlaps). Consider
## increasing max.overlaps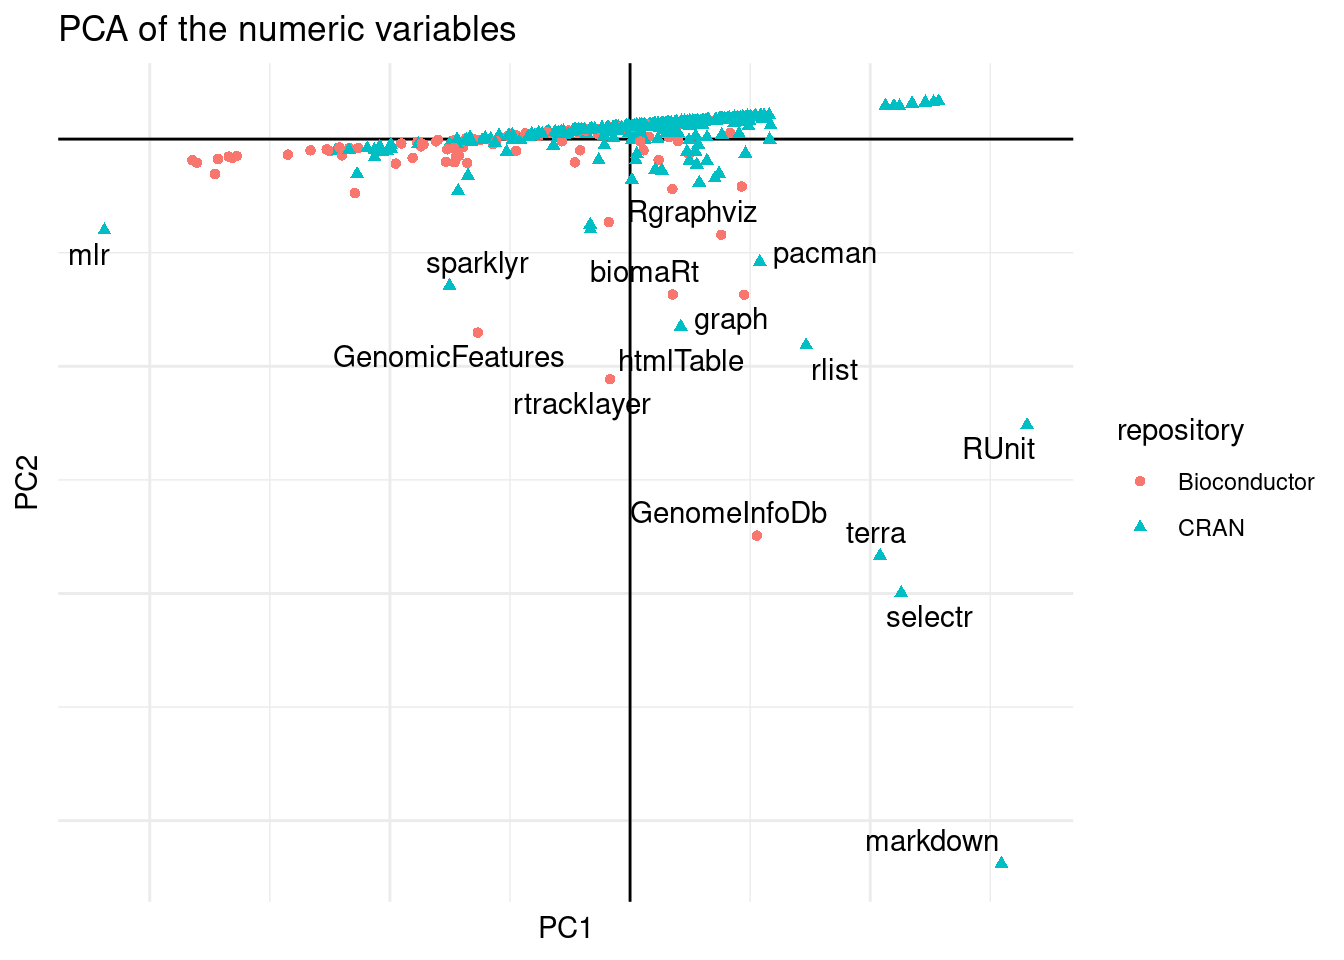
Figure 5: PCA of all packages.
We can see in the first PCA some packages that have many downloads and/or depend on many packages.
The second one are packages with many dependencies, as explained by rotation:
pca_all$rotation[, 1:2]| PC1 | PC2 | |
|---|---|---|
| first_deps_n | -0.6521642 | -0.1528947 |
| deps_all_n | -0.3304698 | -0.0549046 |
| first_rdeps_n | 0.1235972 | -0.6948659 |
| first_deps_strong_n | -0.6606765 | -0.0750116 |
| downloads | 0.1170554 | -0.6965223 |
But more important is that are packages that are named in 5, there is the RUnit package, markdown and rgeos that have high number of downloads and many package depend on them one way or another.
However we can focus on packages that without RCurl or XML wouldn’t work:
pca_strong <- prcomp(deps_wo[deps_wo$strong, cols_pca],
                     scale. = TRUE, center = TRUE)
summary(pca_strong)
## Importance of components:
##                           PC1    PC2    PC3     PC4     PC5
## Standard deviation     1.4198 1.3005 0.9373 0.49421 0.41258
## Proportion of Variance 0.4032 0.3382 0.1757 0.04885 0.03404
## Cumulative Proportion  0.4032 0.7414 0.9171 0.96596 1.00000
pca_data_strong <- cbind(pca_strong$x, deps_wo[deps_wo$strong, ])
ggplot(pca_data_strong) +
  geom_hline(yintercept = 0) +
  geom_vline(xintercept = 0) +
  geom_point(aes(PC1, PC2, col = repository, shape = repository)) +
    geom_text_repel(aes(PC1, PC2, label = package),
                  data = filter(pca_data_strong, abs(PC1) > 2 | abs(PC2) > 2)) +
  theme_minimal() +
  theme(axis.text = element_blank()) +
  labs(title = "Important packages depending on XML and RCurl",
       subtitle = "PCA of numeric variables of strong dependencies",
       col = "Repository", shape = "Repository")
## Warning: ggrepel: 42 unlabeled data points (too many overlaps). Consider
## increasing max.overlaps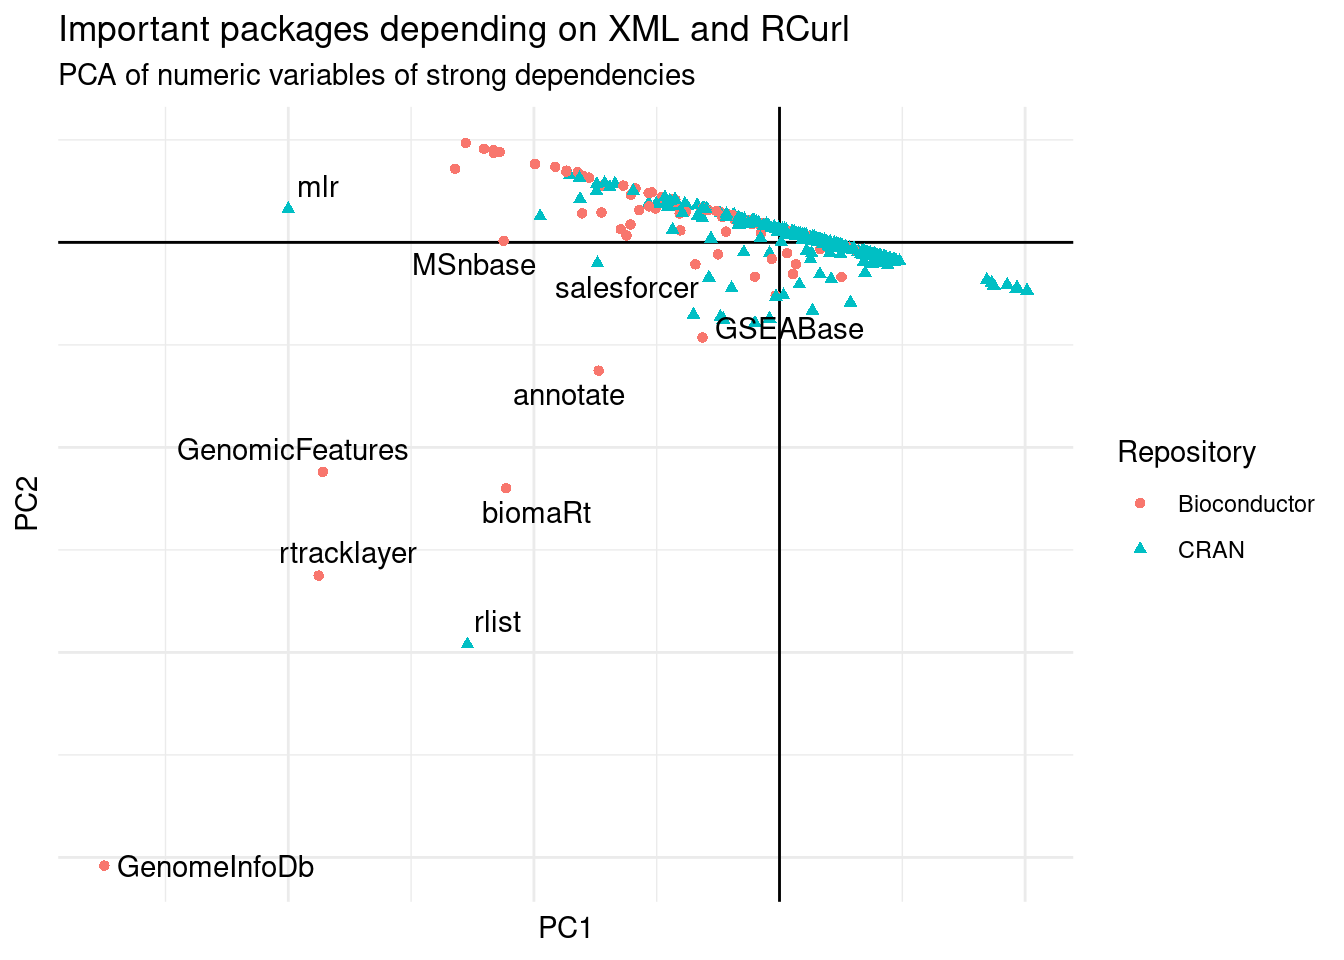
Figure 6: PCA of packages with strong dependency to XML or RCurl.
The main packages that depend on XML and RCurl are from Biocondcutor, followed by mlr and rlist. rlist has as dependency XML and only uses 3 functions from it. mlr uses 5 different functions from XML.
pca_weak <- prcomp(deps_wo[!deps_wo$strong, cols_pca],
                   scale. = TRUE, center = TRUE)
summary(pca_weak)
## Importance of components:
##                           PC1    PC2    PC3     PC4     PC5
## Standard deviation     1.4500 1.1578 0.9901 0.63980 0.40895
## Proportion of Variance 0.4205 0.2681 0.1960 0.08187 0.03345
## Cumulative Proportion  0.4205 0.6886 0.8847 0.96655 1.00000
pca_data_weak <- cbind(pca_weak$x, deps_wo[!deps_wo$strong, ])
ggplot(pca_data_weak) +
  geom_hline(yintercept = 0) +
  geom_vline(xintercept = 0) +
  geom_point(aes(PC1, PC2, col = type, shape = type)) +
  geom_text_repel(aes(PC1, PC2, label = package),
                  data = filter(pca_data_weak, abs(PC1)> 2 | abs(PC2) > 2)) +
  theme_minimal() +
  theme(axis.text = element_blank()) +
  labs(title = "PCA of packages in CRAN", col = "Type", shape = "Type")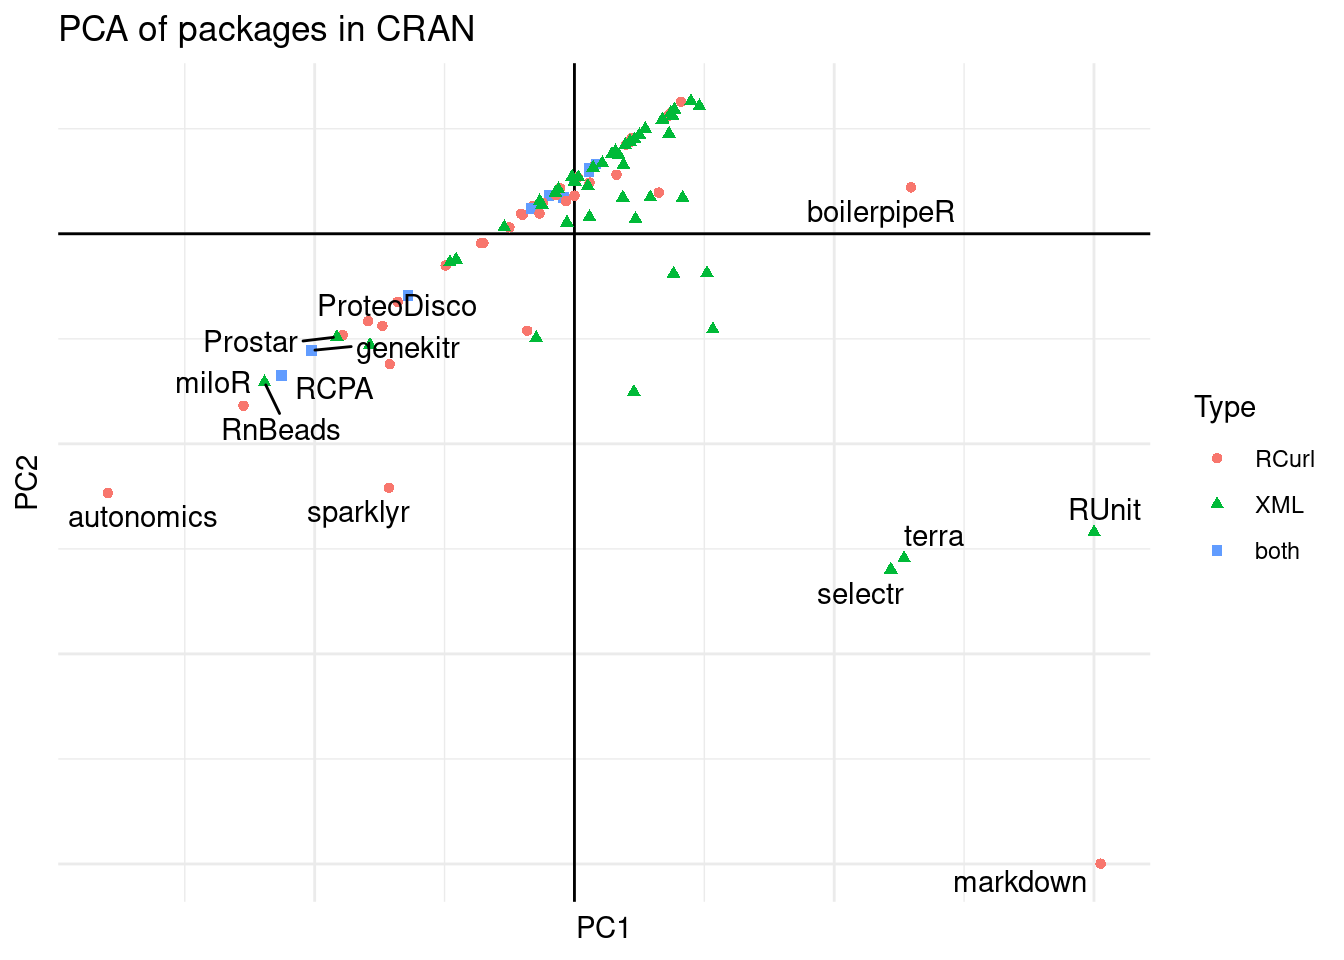
Figure 7: Packages with weak dependency to XML or RCurl.
keep <- deps_wo$repository == "CRAN" & deps_wo$strong
pca_cran <- prcomp(deps_wo[keep, cols_pca],
                     scale. = TRUE, center = TRUE)
summary(pca_cran)
## Importance of components:
##                           PC1    PC2    PC3     PC4     PC5
## Standard deviation     1.4174 1.3060 0.9244 0.51813 0.40278
## Proportion of Variance 0.4018 0.3412 0.1709 0.05369 0.03245
## Cumulative Proportion  0.4018 0.7430 0.9139 0.96755 1.00000
pca_data_strong <- cbind(pca_cran$x, deps_wo[keep, ])
ggplot(pca_data_strong) +
  geom_hline(yintercept = 0) +
  geom_vline(xintercept = 0) +
  geom_point(aes(PC1, PC2, col = type, shape = type)) +
    geom_text_repel(aes(PC1, PC2, label = package),
                  data = filter(pca_data_strong, abs(PC1) > 2 | abs(PC2) > 2)) +
  theme_minimal() +
  theme(axis.text = element_blank()) +
  labs(title = "Packages in CRAN",
       col = "Type", shape = "Type")
## Warning: ggrepel: 26 unlabeled data points (too many overlaps). Consider
## increasing max.overlaps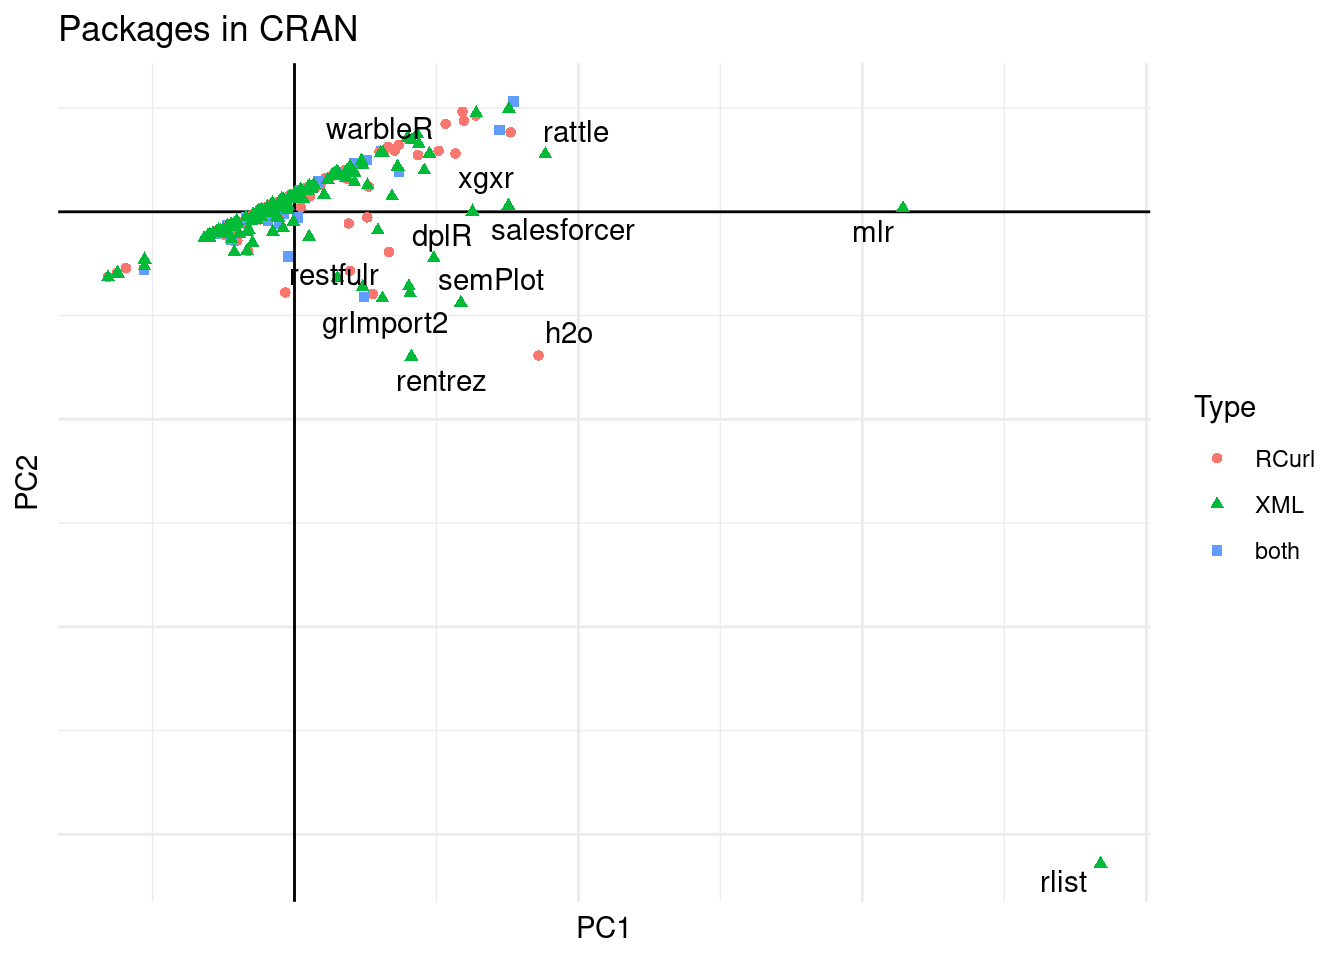
Figure 8: PCA of packages on CRAN.
keep <- deps_wo$repository == "Bioconductor"  & deps_wo$strong
pca_bioc <- prcomp(deps_wo[keep, cols_pca],
                     scale. = TRUE, center = TRUE)
summary(pca_bioc)
## Importance of components:
##                           PC1    PC2    PC3     PC4     PC5
## Standard deviation     1.4913 1.3703 0.8495 0.33584 0.25281
## Proportion of Variance 0.4448 0.3755 0.1443 0.02256 0.01278
## Cumulative Proportion  0.4448 0.8203 0.9647 0.98722 1.00000
pca_data_strong <- cbind(pca_bioc$x, deps_wo[keep, ])
ggplot(pca_data_strong) +
  geom_hline(yintercept = 0) +
  geom_vline(xintercept = 0) +
  geom_point(aes(PC1, PC2, col = type, shape = type)) +
    geom_text_repel(aes(PC1, PC2, label = package),
                  data = filter(pca_data_strong, abs(PC1) > 2 | abs(PC2) > 2)) +
  theme_minimal() +
  theme(axis.text = element_blank()) +
  labs(title = "Packages in Bioconductor",
       subtitle = "PCA of numeric variables of strong dependencies",
       col = "Type", shape = "Type")
## Warning: ggrepel: 4 unlabeled data points (too many overlaps). Consider
## increasing max.overlaps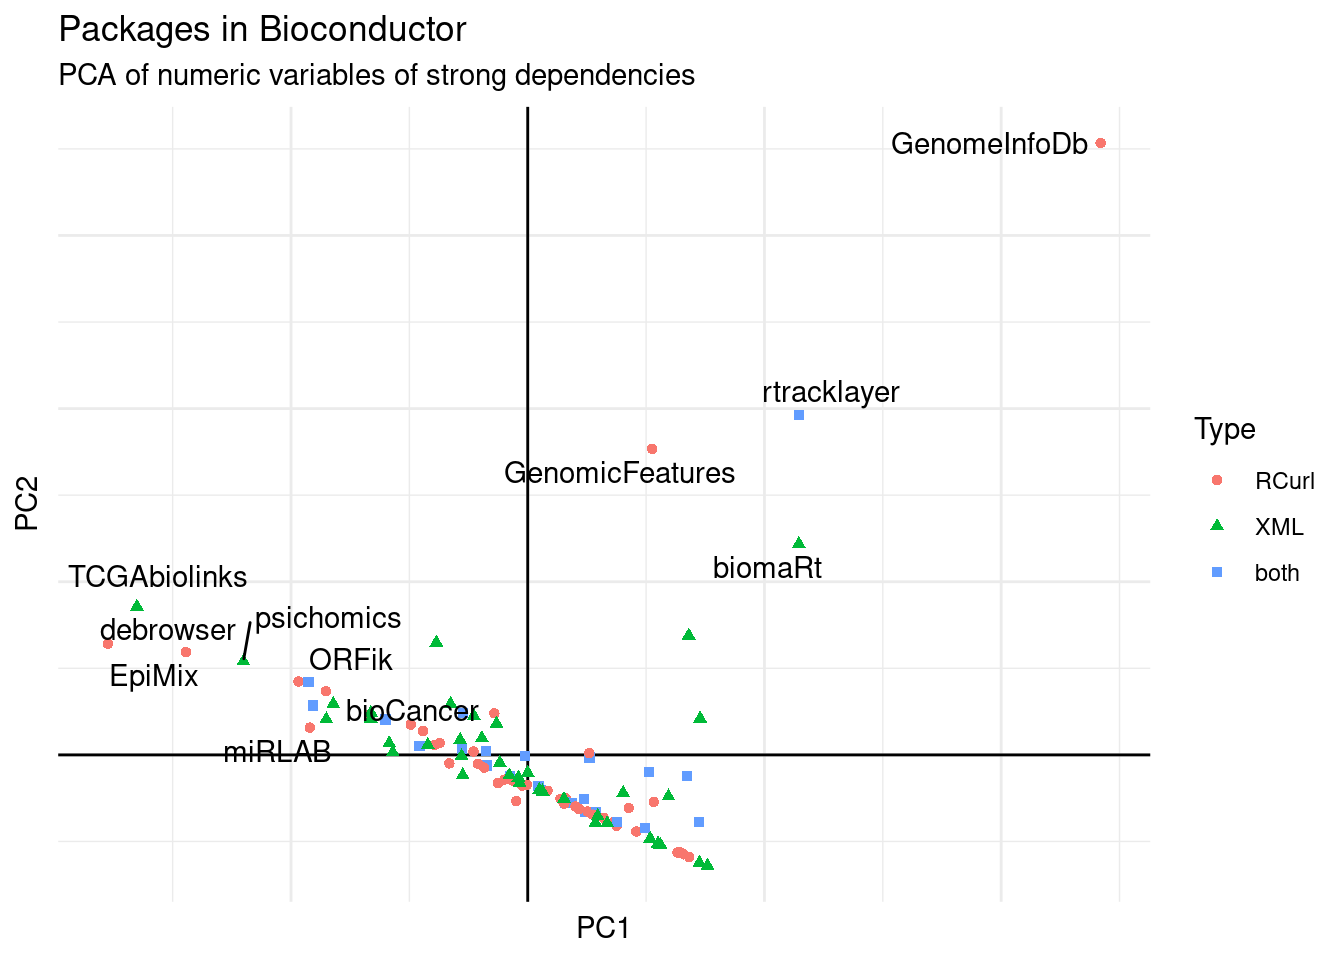
Figure 9: PCA of packages on Bioconductor.
GenomeInfoDb is the package that seems more important that only uses the RCurl::getURL function.
Outro
I wanted to explore a bit how these packages got into this position 3.
deps |>
  filter(strong) |>
  ggplot() +
  geom_vline(xintercept = as.Date("2013-06-15"), linetype = 2) +
  geom_point(aes(first_release, downloads, col = type, shape = type,
                 size = first_deps_strong_n)) +
  geom_label(aes(first_release, downloads, label = package),
             data = filter(deps, package %in% c("XML", "RCurl")), show.legend = FALSE) +
  theme_minimal() +
  scale_y_log10(labels = scales::label_log()) +
  annotate("text", x = as.Date("2014-6-15"), y = 5*10^5,
           label = "CRAN maintained", hjust = 0) +
  labs(x = "Release date", y = "Downloads",
       title = "More packages added after CRAN maintenance than before",
       subtitle = "Release date and downloads",
       col = "Depends on", shape = "Depends on", size = "Direct strong dependencies")
## Warning: Removed 34 rows containing missing values (`geom_point()`).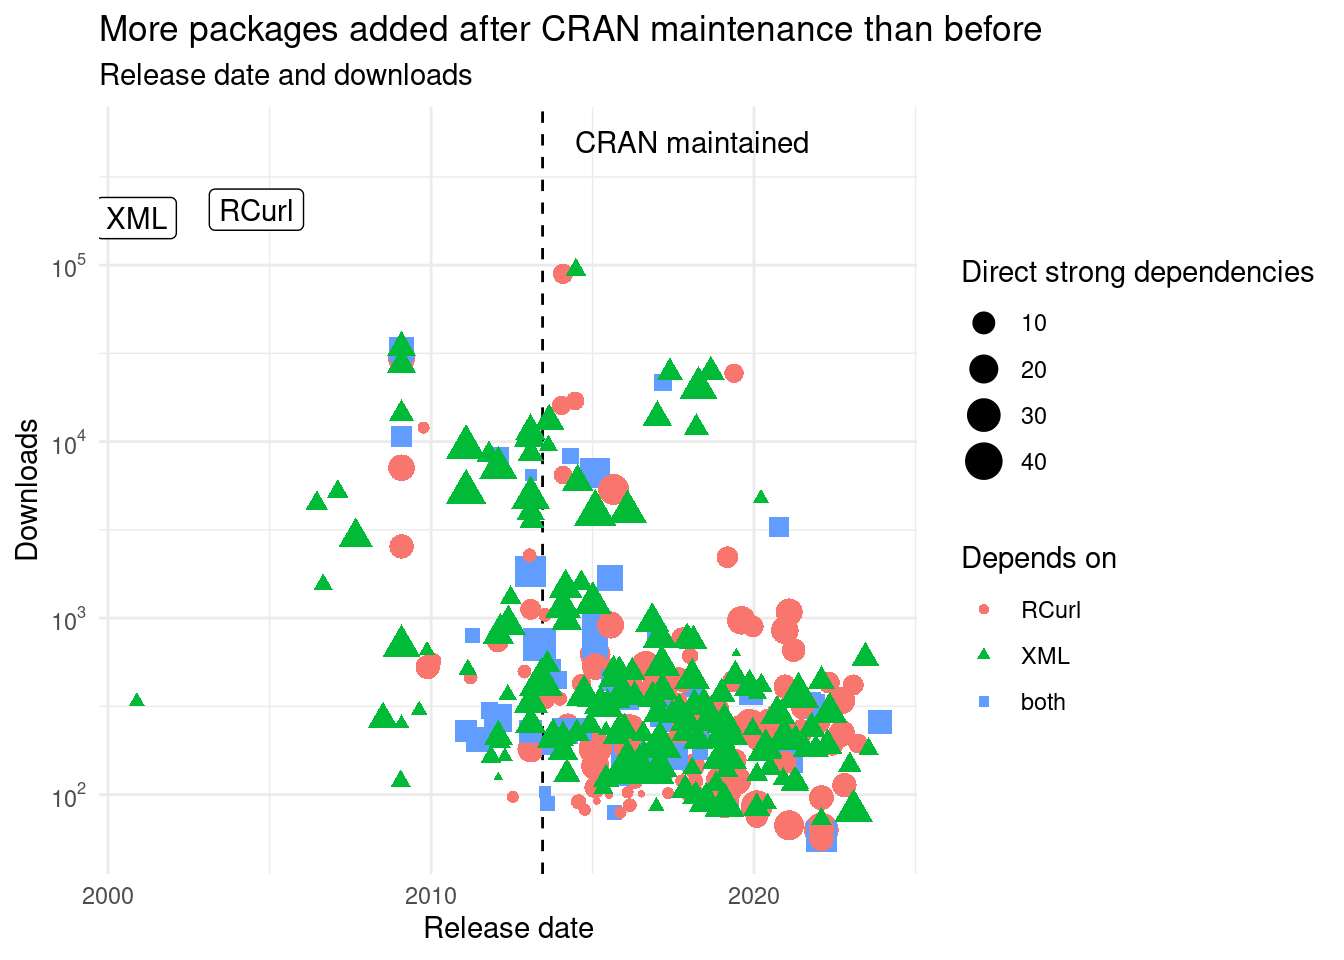
Figure 10: First release of packages in relation to the maintenance by CRAN of XML and RCurl.
Almost the CRAN team have been maintaining these packages longer than the previous maintainer(s?).
Next, we look at the dependencies added after CRAN started maintaining them
summarize(deps_wo,
          before = sum(first_release <= as.Date("2013-06-15"), na.rm = TRUE),
          later = sum(first_release > as.Date("2013-06-15"), na.rm = TRUE),
.by = type)| type | before | later |
|---|---|---|
| both | 14 | 52 |
| RCurl | 21 | 150 |
| XML | 63 | 156 |
More packages have been released after CRAN is maintaining it than before. Maybe packages authors trusted the CRAN team for their dependencies or there was no other alternative for the functionality. This might also be explained by the expansion of CRAN (and Bioconductor) with more packages being added each day. However, this places further pressure in the CRAN team to maintain those packages. Removing this burden might free more time for them or to dedicate to CRAN.
A replacement for XML could be xml2, first released in 2015 (which uses the same system dependency libxml2).
A replacement for RCurl could be curl, first released at the end of 2014 (which uses the same system dependency libcurl).
Until their release there were no other replacement for these packages (if there are other packages, please let me know). It is not clear to me if those packages at their first release could replace XML and RCurl.
This highlight the importance of correct replacement of packages in the community. Recent examples are the efforts taken by the spatial community led by Roger Bivand, Edzer Pebesma. Where packages have been carefully designed and planned to replace older packages that are going to be retired soon.
Recomendations
As a final recommendations I think:
- Disentangle the XML and RCurl circular dependency.
- Evaluate if the xml2 and curl packages provides enough functionality to replace XML and RCurl respectively.
If not see what should be added to these packages or how to develop alternative packages to fill the gap if needed.
Maybe a helping documentation about the alternative from XML and RCurl could be written to ease the transition and evaluate if the functionality is covered by these packages. - Contact package maintainers to replace the functionality they currently depend on XML and RCurl as seen in 4 and the maintainers of packages seen in figures 5, 6, 8, and 9.
- Set deprecation warnings on the XML and RCurl packages.
- Archive XML and RCurl packages in CRAN.
This might take years of moving packages around but I am confident that once the word is out, package developers will avoid XML and RCurl and current maintainers that depend on them will replace them.
Update:
On 2024/01/22 the CRAN team asked for a maintainer of XML
Reproducibility
## - Session info ---------------------------------------------------------------
##  setting  value
##  version  R version 4.3.1 (2023-06-16)
##  os       Ubuntu 22.04.3 LTS
##  system   x86_64, linux-gnu
##  ui       X11
##  language (EN)
##  collate  C
##  ctype    C
##  tz       Europe/Madrid
##  date     2024-01-22
##  pandoc   3.1.1 @ /usr/lib/rstudio/resources/app/bin/quarto/bin/tools/ (via rmarkdown)
##
## - Packages -------------------------------------------------------------------
##  package       * version     date (UTC) lib source
##  Biobase         2.62.0      2023-10-24 [1] Bioconductor
##  BiocFileCache   2.10.1      2023-10-26 [1] Bioconductor
##  BiocGenerics    0.48.1      2023-11-01 [1] Bioconductor
##  BiocManager     1.30.22     2023-08-08 [1] CRAN (R 4.3.1)
##  BiocPkgTools  * 1.20.0      2023-10-24 [1] Bioconductor
##  biocViews       1.70.0      2023-10-24 [1] Bioconductor
##  bit             4.0.5       2022-11-15 [1] CRAN (R 4.3.1)
##  bit64           4.0.5       2020-08-30 [1] CRAN (R 4.3.1)
##  bitops          1.0-7       2021-04-24 [1] CRAN (R 4.3.1)
##  blob            1.2.4       2023-03-17 [1] CRAN (R 4.3.1)
##  blogdown        1.18        2023-06-19 [1] CRAN (R 4.3.1)
##  bookdown        0.37        2023-12-01 [1] CRAN (R 4.3.1)
##  bslib           0.6.1       2023-11-28 [1] CRAN (R 4.3.1)
##  cachem          1.0.8       2023-05-01 [1] CRAN (R 4.3.1)
##  cli             3.6.2       2023-12-11 [1] CRAN (R 4.3.1)
##  codetools       0.2-19      2023-02-01 [2] CRAN (R 4.3.1)
##  colorspace      2.1-0       2023-01-23 [1] CRAN (R 4.3.1)
##  cranlogs      * 2.1.1       2019-04-29 [1] CRAN (R 4.3.1)
##  crul            1.4.0       2023-05-17 [1] CRAN (R 4.3.1)
##  curl            5.2.0       2023-12-08 [1] CRAN (R 4.3.1)
##  DBI             1.2.1       2024-01-12 [1] CRAN (R 4.3.1)
##  dbplyr          2.4.0       2023-10-26 [1] CRAN (R 4.3.2)
##  digest          0.6.34      2024-01-11 [1] CRAN (R 4.3.1)
##  dplyr         * 1.1.4       2023-11-17 [1] CRAN (R 4.3.1)
##  DT              0.31        2023-12-09 [1] CRAN (R 4.3.1)
##  evaluate        0.23        2023-11-01 [1] CRAN (R 4.3.2)
##  fansi           1.0.6       2023-12-08 [1] CRAN (R 4.3.1)
##  farver          2.1.1       2022-07-06 [1] CRAN (R 4.3.1)
##  fastmap         1.1.1       2023-02-24 [1] CRAN (R 4.3.1)
##  fauxpas         0.5.2       2023-05-03 [1] CRAN (R 4.3.1)
##  filelock        1.0.3       2023-12-11 [1] CRAN (R 4.3.1)
##  generics        0.1.3       2022-07-05 [1] CRAN (R 4.3.1)
##  ggplot2       * 3.4.4       2023-10-12 [1] CRAN (R 4.3.1)
##  ggrepel       * 0.9.5       2024-01-10 [1] CRAN (R 4.3.1)
##  gh              1.4.0       2023-02-22 [1] CRAN (R 4.3.1)
##  glue            1.7.0       2024-01-09 [1] CRAN (R 4.3.1)
##  graph           1.80.0      2023-10-24 [1] Bioconductor
##  gtable          0.3.4       2023-08-21 [1] CRAN (R 4.3.1)
##  highr           0.10        2022-12-22 [1] CRAN (R 4.3.1)
##  hms             1.1.3       2023-03-21 [1] CRAN (R 4.3.1)
##  htmltools       0.5.7       2023-11-03 [1] CRAN (R 4.3.2)
##  htmlwidgets   * 1.6.4       2023-12-06 [1] CRAN (R 4.3.1)
##  httpcode        0.3.0       2020-04-10 [1] CRAN (R 4.3.1)
##  httr            1.4.7       2023-08-15 [1] CRAN (R 4.3.1)
##  igraph          1.6.0       2023-12-11 [1] CRAN (R 4.3.1)
##  jquerylib       0.1.4       2021-04-26 [1] CRAN (R 4.3.1)
##  jsonlite        1.8.8       2023-12-04 [1] CRAN (R 4.3.1)
##  knitr         * 1.45        2023-10-30 [1] CRAN (R 4.3.2)
##  labeling        0.4.3       2023-08-29 [1] CRAN (R 4.3.2)
##  lifecycle       1.0.4       2023-11-07 [1] CRAN (R 4.3.2)
##  magrittr        2.0.3       2022-03-30 [1] CRAN (R 4.3.1)
##  memoise         2.0.1       2021-11-26 [1] CRAN (R 4.3.1)
##  munsell         0.5.0       2018-06-12 [1] CRAN (R 4.3.1)
##  pillar          1.9.0       2023-03-22 [1] CRAN (R 4.3.1)
##  pkgconfig       2.0.3       2019-09-22 [1] CRAN (R 4.3.1)
##  purrr           1.0.2       2023-08-10 [1] CRAN (R 4.3.1)
##  R6              2.5.1       2021-08-19 [1] CRAN (R 4.3.1)
##  RBGL            1.78.0      2023-10-24 [1] Bioconductor
##  Rcpp            1.0.12      2024-01-09 [1] CRAN (R 4.3.1)
##  RCurl           1.98-1.14   2024-01-09 [1] CRAN (R 4.3.1)
##  readr           2.1.5       2024-01-10 [1] CRAN (R 4.3.1)
##  rlang           1.1.3       2024-01-10 [1] CRAN (R 4.3.1)
##  rmarkdown       2.25        2023-09-18 [1] CRAN (R 4.3.1)
##  rorcid          0.7.0       2021-01-20 [1] CRAN (R 4.3.1)
##  RSQLite         2.3.5       2024-01-21 [1] CRAN (R 4.3.1)
##  rstudioapi      0.15.0      2023-07-07 [1] CRAN (R 4.3.1)
##  RUnit           0.4.32      2018-05-18 [1] CRAN (R 4.3.1)
##  rvest           1.0.3       2022-08-19 [1] CRAN (R 4.3.1)
##  sass            0.4.8       2023-12-06 [1] CRAN (R 4.3.1)
##  scales          1.3.0       2023-11-28 [1] CRAN (R 4.3.1)
##  sessioninfo     1.2.2       2021-12-06 [1] CRAN (R 4.3.1)
##  stringi         1.8.3       2023-12-11 [1] CRAN (R 4.3.1)
##  stringr         1.5.1       2023-11-14 [1] CRAN (R 4.3.1)
##  tibble          3.2.1       2023-03-20 [1] CRAN (R 4.3.1)
##  tidyselect      1.2.0       2022-10-10 [1] CRAN (R 4.3.1)
##  tzdb            0.4.0       2023-05-12 [1] CRAN (R 4.3.1)
##  utf8            1.2.4       2023-10-22 [1] CRAN (R 4.3.2)
##  vctrs           0.6.5       2023-12-01 [1] CRAN (R 4.3.1)
##  whisker         0.4.1       2022-12-05 [1] CRAN (R 4.3.1)
##  withr           3.0.0       2024-01-16 [1] CRAN (R 4.3.1)
##  xfun            0.41        2023-11-01 [1] CRAN (R 4.3.2)
##  XML             3.99-0.16.1 2024-01-22 [1] CRAN (R 4.3.1)
##  xml2            1.3.6       2023-12-04 [1] CRAN (R 4.3.1)
##  yaml            2.3.8       2023-12-11 [1] CRAN (R 4.3.1)
##
##  [1] /home/lluis/bin/R/4.3.1
##  [2] /opt/R/4.3.1/lib/R/library
##
## ------------------------------------------------------------------------------