Submissions accepted on the first try
Recently someone in social media was saying that they do not succeed on submissions to CRAN on the first try. In this post I’ll try to answer this question.
First we need to know the submissions to CRAN. We can download the last 3 years of CRAN submissions thanks to cransays.
cdh <- cransays::download_history()Here is the bulk of the analysis of the history of package submissions. This is explained in different posts, but basically I keep only one package per snapshot, try to identify new submissions instead of changes in the same submission and calculate some date-related variables.
library("dplyr", warn.conflicts	 = FALSE)
library("lubridate", warn.conflicts	 = FALSE)
library("tidyr", warn.conflicts	 = FALSE)
diff0 <- structure(0, class = "difftime", units = "hours")
cran <- cdh |>
  filter(!is.na(version)) |>
  distinct() |>
  arrange(package, snapshot_time) |>
  group_by(package, snapshot_time) |>
  # Remove some duplicated packages in different folders
  mutate(n = seq_len(n())) |>
  filter(n == n()) |>
  ungroup() |>
  select(-n) |>
  arrange(package, snapshot_time, version) |>
  # Packages last seen in queue less than 24 ago are considered same submission
  # (even if their version number differs)
  mutate(diff_time = difftime(snapshot_time, lag(snapshot_time), units = "hour"),
         diff_time = if_else(is.na(diff_time), diff0, diff_time), # Fill NAs
         diff_v = version != lag(version),
         diff_v = if_else(is.na(diff_v), TRUE, diff_v), # Fill NAs
         near_t = abs(diff_time) <= 24,
         resubmission = !near_t | diff_v,
         resubmission = if_else(resubmission == FALSE & diff_time == 0,
                               TRUE, resubmission),
         resubmission_n = cumsum(as.numeric(resubmission)),
         new_version = !near(diff_time, 1, tol = 24) & diff_v,
         new_version = if_else(new_version == FALSE & diff_time == 0,
                               TRUE, new_version),
         submission_n = cumsum(as.numeric(new_version)), .by = package) |>
  select(-diff_time, -diff_v, -new_version, -new_version, -near_t) |>
  mutate(version = package_version(version, strict = FALSE),
         date = as_date(snapshot_time))
Now we need to compare with the CRAN archive to know if the submission were accepted.
First we need to retrieve the data:
cran_archive <- tools:::CRAN_archive_db()
# When row binding the data.frames that have only one row lose they row name:
# handle those cases to keep the version number:
archived <- vapply(cran_archive, NROW, numeric(1L))
names(cran_archive)[archived == 1L] <- vapply(cran_archive[archived == 1L], rownames, character(1L))
# Merge current and archive data
cran_dates <- do.call(rbind, cran_archive)
cran_dates$type <- "archived"
current <- tools:::CRAN_current_db()
current$type <- "available"
cran_h <- rbind(current, cran_dates)
# Keep minimal CRAN data archive
cran_h$pkg_v <- basename(rownames(cran_h))
rownames(cran_h) <- NULL
cda <- cran_h |>
  mutate(strcapture(x = pkg_v, "^(.+)_([0-9]*.+).tar.gz$",
                    proto = data.frame(package = character(), version = character())),
         package = if_else(is.na(package), pkg_v, package)) |>
  arrange(package, mtime) |>
  mutate(acceptance_n = seq_len(n()), .by = package) |>
  select(package, pkg_v, version, acceptance_n, date = mtime, uname, type) |>
  mutate(date = as_date(date))
We use tools:::CRAN_current_db, because package.available will filter packages based on OS and other options (see the filter argument).
We can make a quick detour to plot the number of accepted articles and when were they first published:
library("ggplot2")
cdas <- cda |>
  summarize(available = if_else(any(type == "available"), "available", "archived"),
            published = min(date),
            n_published = max(acceptance_n),
            .by = package)

ggplot(cdas) +
  geom_point(aes(published, n_published, col = available, shape = available)) +
  theme_minimal() +
  theme(legend.position = c(0.7, 0.8), legend.background = element_rect()) +
  labs(x = element_blank(), y = "Versions", col = "Status", shape = "Status",
       title = "First publication of packages and versions published") +
  scale_x_date(expand = expansion(), date_breaks = "2 years", date_labels = "%Y")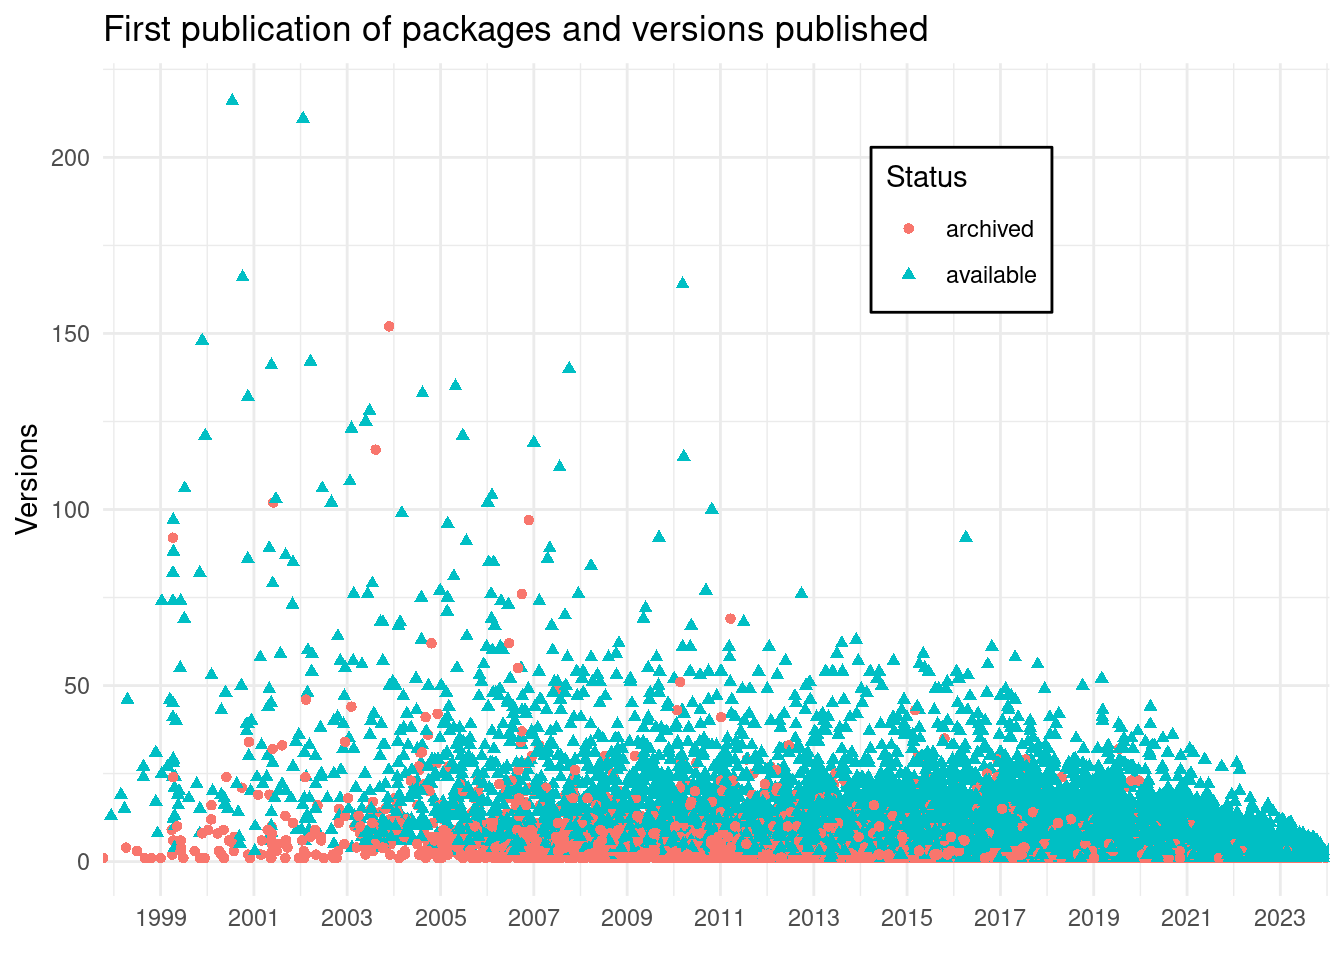
In summary, there are 6291 packages archived, and 20304 available. We can observe that there is a package that had more than 150 versions that was later archived.
Now we can really compare the submission process with the CRAN archive:
cran_subm <- cran |>
  summarise(
    resubmission_n = max(resubmission_n, na.rm = TRUE),
    submission_n = max(submission_n, na.rm = TRUE),
    # The number of submissions
    submissions = resubmission_n - submission_n + 1,
    date = min(date),
    .by = c("package", "version")) |>
  arrange(package, version)
# Filter to those packages submitted in the period we have data
cda_acc <- cda |>
  filter(date >= min(cran_subm$date)) |>
  select(-pkg_v) |>
  mutate(version = package_version(version, FALSE))

accepted_subm <- merge(cda_acc, cran_subm, by = c("package", "version"),
             suffixes = c(".cran", ".subm"), all = TRUE, sort = FALSE) |>
  arrange(package, version, date.cran, date.subm) |>
  mutate(submissions = if_else(is.na(submissions), 1, submissions),
         acceptance_n = if_else(is.na(acceptance_n), 0, acceptance_n))
We can explore a little bit this data:
lp <- scales::label_percent(accuracy = 0.1)
accepted_subm |>
  summarize(cransays = sum(!is.na(date.subm)),
            cran = sum(!is.na(date.cran)),
            missed_submissions = cran - cransays,
percentaged_missed = lp(missed_submissions/cran))| cransays | cran | missed_submissions | percentaged_missed |
|---|---|---|---|
| 46525 | 50413 | 3888 | 7.7% |
This means that cransays, the package used to archive this data, misses ~8% of submissions, probably because they are handled in less than an hour!! Another explanation might be because for some periods cransays bot didn’t work well…
On the other hand we can look how long does it take for a version to be published on CRAN:
accepted_subm |>
  filter(!is.na(date.cran)) |>
  mutate(time_diff = difftime(date.cran, date.subm, units = "weeks")) |>
  # Calculate the number of accepted packages sine the recording of submissions
  mutate(accepted_n = acceptance_n - min(acceptance_n[acceptance_n != 0L], na.rm = TRUE) + 1, .by = package) |>
  filter(time_diff >= 0) |>
  ggplot() +
  geom_point(aes(date.cran, time_diff, col = accepted_n)) +
  theme_minimal() +
  theme(legend.position = c(0.2, 0.8), legend.background = element_rect()) +
  labs(x = "Published on CRAN", title = "Time since submitted to CRAN",
       y = "Weeks", col = "Accepted")
## Don't know how to automatically pick scale for object of type <difftime>.
## Defaulting to continuous.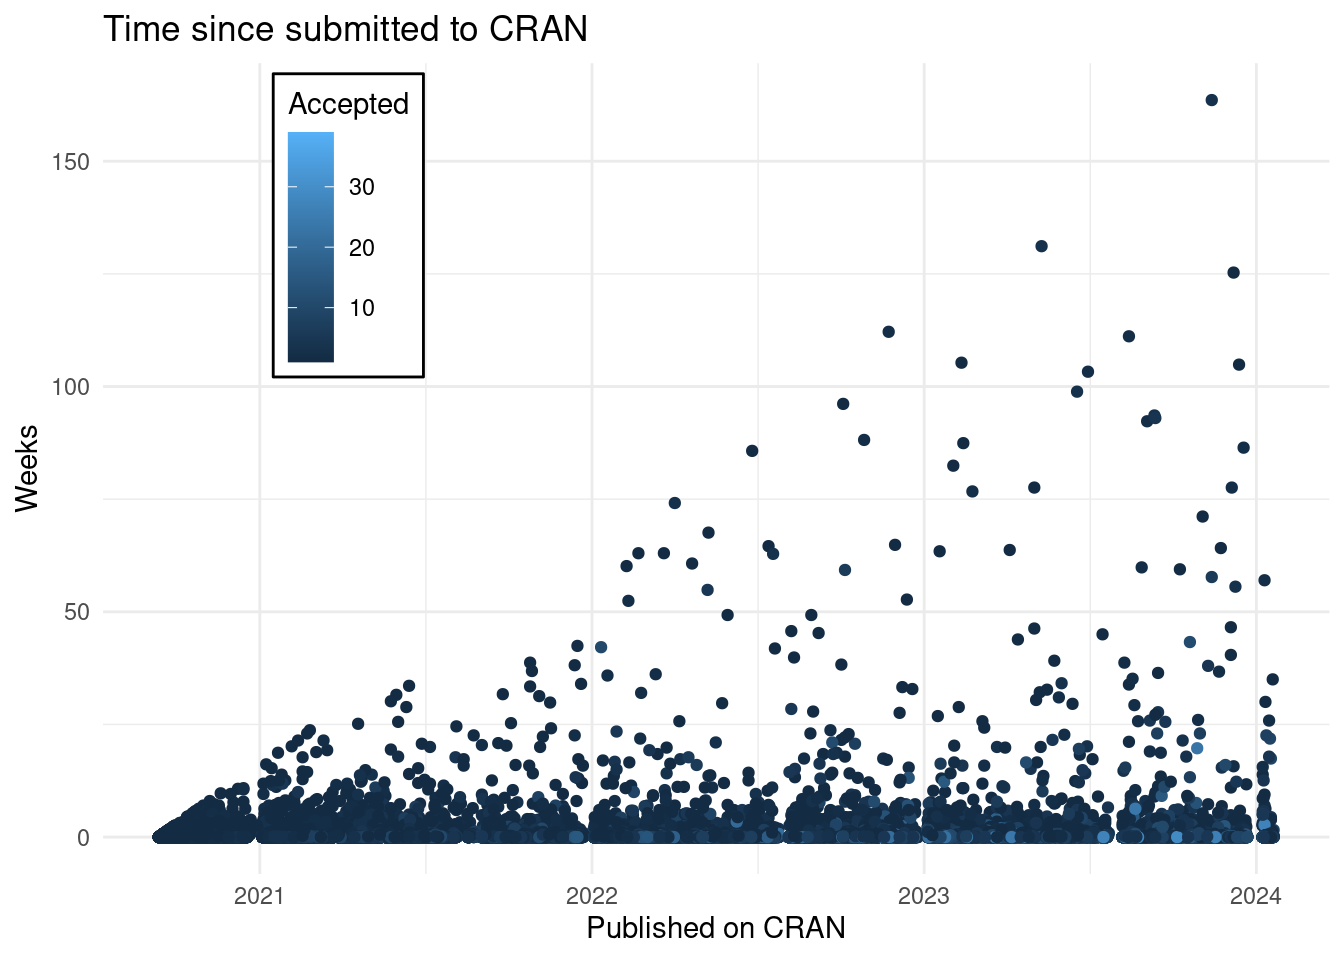
I explored some of those outliers and there is a package that was submitted in 2021 and two years later it was submitted with the same version. In other cases the submission was done with more than 1 hour of tolerance (see the “new_version” variable creation in the second code chunk.)
This means that the path to CRAN might be long and that developers do not change the version number on each submission.
Note: This section is new after detecting problems with the way it was initially published.
In the following function I calculate the number of submissions and similar information for each package:
count_submissions <- function(x) {
  x |>
    mutate(submission_in_period = seq_len(n()),
           date.mix = pmin(date.cran, date.subm, na.rm = TRUE),
           .by = package, .after = acceptance_n) |>
    summarise(
      # Number of accepted packages on CRAN
      total_accepted = sum(!is.na(date.cran), 0, na.rm = TRUE),
      # At minimum 0 through {cransays}
      through_cransays = sum(!is.na(date.subm), 0, na.rm = TRUE),
      # In case same version number is submitted at different timepoints
      resubmissions = ifelse(any(!is.na(resubmission_n)),
                              max(resubmission_n, na.rm = TRUE) - min(resubmission_n, na.rm = TRUE) - through_cransays, 0),
      resubmissions = if_else(resubmissions < 0L, 0L, resubmissions),
      # All submission + those that were duplicated on the submission system
      total_submissions = max(submission_in_period, na.rm = TRUE) + resubmissions,
      # The submissions that were not successful
      total_attempts = total_submissions - total_accepted,
      percentage_failed_submissions = lp(total_attempts/total_accepted),
      .by = package)
}
I created a function to apply the same logic in whatever group I want to analyse.
Note: Another relevant edit was that the selection criteria changed as I missed some packages in some analysis and included other that shouldn’t be. Now we are ready to apply to those that got the first version of the package on CRAN:
first_submissions <- accepted_subm |>
  group_by(package) |>
  # Keep submission that where eventually accepted
  filter(length(acceptance_n != 0L) > 1L && any(acceptance_n[acceptance_n != 0L] == 1)) |>
  # Keep submissions until the first acceptance but not after
  filter(cumsum(acceptance_n) <= 1L & seq_len(n()) <= which(acceptance_n == 1L)) |>
  ungroup()
ffs <- first_submissions |>
  count_submissions() |>
  count(total_attempts, sort = TRUE,  name = "packages") |>
  mutate(percentage = lp(packages/sum(packages, na.rm = TRUE)))
ffs| total_attempts | packages | percentage |
|---|---|---|
| 0 | 3390 | 65.0% |
| 1 | 1141 | 21.9% |
| 2 | 425 | 8.2% |
| 3 | 138 | 2.6% |
| 4 | 72 | 1.4% |
| 5 | 23 | 0.4% |
| 6 | 12 | 0.2% |
| 7 | 4 | 0.1% |
| 8 | 3 | 0.1% |
| 9 | 2 | 0.0% |
| 12 | 1 | 0.0% |
| 16 | 1 | 0.0% |
This means that close to 35.0% first time submissions are rejected. Including those that are not yet (never?) included on CRAN (~1000).
This points out a problem:
- the developers need to resubmit their packages and fix it more.
- the reviewers need to spend more time (approximately 50% of submissions are at one point or another handled by a human).
After this exercise we might wonder whether this is just for new packages?
If we look up those submissions that are not the first version of a package, we find the following:
submissions_with_accepted <- accepted_subm |>
  # Filter those that were included on CRAN (not all submission rejected)
  filter(any(acceptance_n >= 1), .by = package) |>
  mutate(date.mix = pmin(date.cran, date.subm, na.rm = TRUE)) |>
  group_by(package) |>
  arrange(date.mix) |>
  filter(
    # Those that start by 0 but next acceptance is 1 or higher
     cumsum(acceptance_n) >= 1L |
       min(acceptance_n[acceptance_n != 0L], na.rm = TRUE) >= 2) |>
  ungroup()
fs_exp <- count_submissions(submissions_with_accepted)
fs_exp |>
  count(more_failed = total_accepted > total_attempts,
            sort = TRUE, name = "packages") |>
mutate(percentage = lp(packages/sum(packages)))| more_failed | packages | percentage |
|---|---|---|
| TRUE | 15337 | 96.2% |
| FALSE | 600 | 3.8% |
Still the majority of packages have more attempts than versions released in the period analysed. Failing the checks on CRAN is normal, but how many more attempts are to CRAN?
library("ggrepel")
ggplot(fs_exp) +
  geom_abline(slope = 1, intercept = 0, linetype = 2) +
  geom_count(aes(total_accepted, total_attempts)) +
  geom_label_repel(aes(total_accepted, total_attempts, label = package), data = . %>% filter(total_attempts >= 10)) +
  labs(x = "CRAN versions", y = "Rejected submissions",  size = "Packages",
       title = "Packages after the first version", subtitle = "for the period analyzed") +
  scale_size(trans = "log10") +
  theme_minimal() +
  theme(legend.position = c(0.8, 0.7), legend.background = element_rect())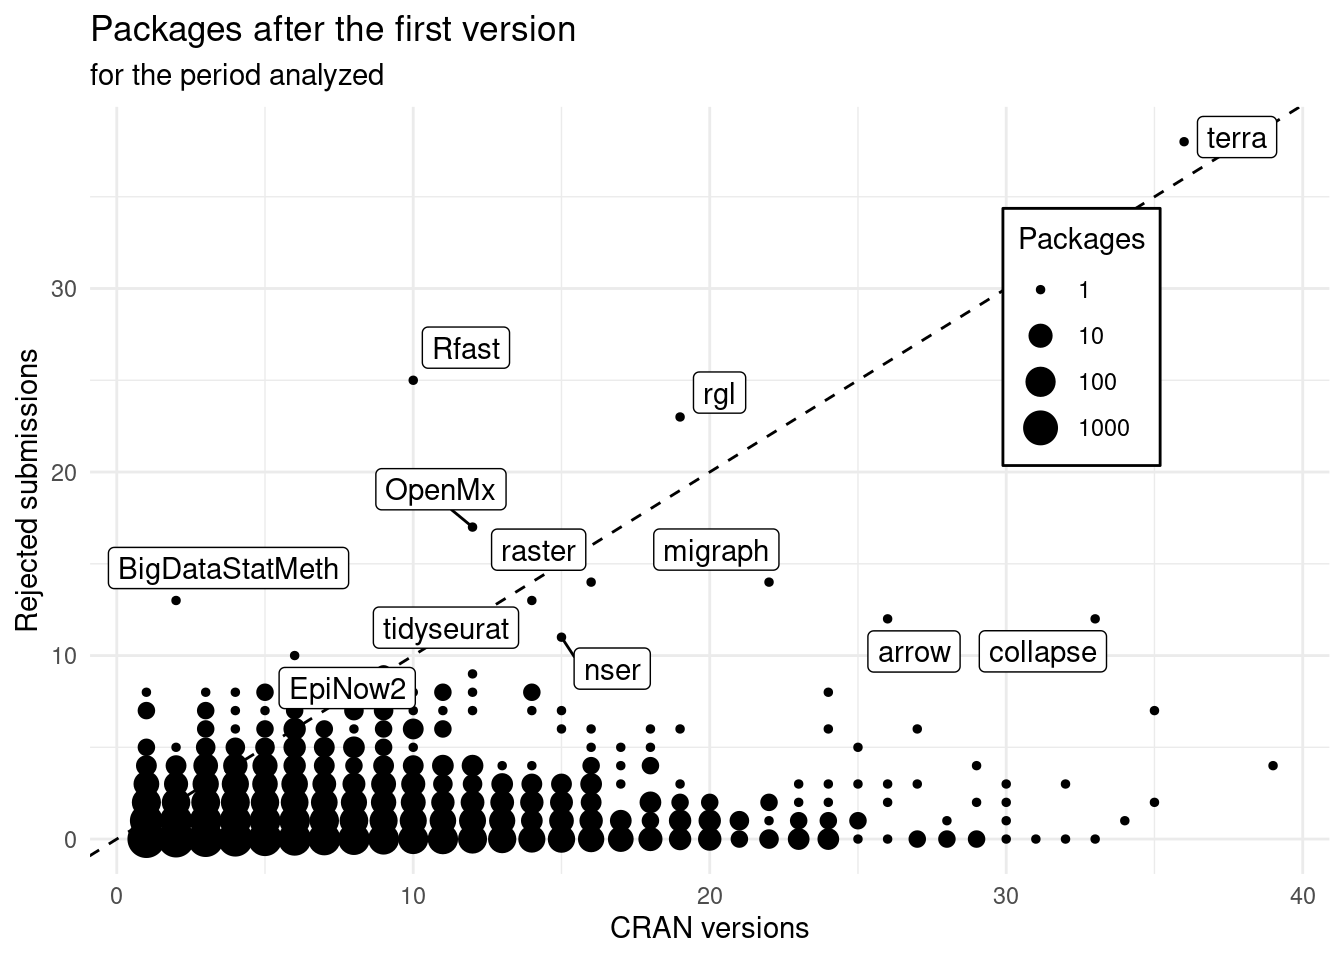
We can see that there are packages with more than 30 versions on CRAN in these 3 years which never had a rejected submission. Congratulations!!
Others have a high number of submissions rejected, and very few versions:
fs_exp |>
  count(total_attempts > total_accepted, name = "packages") |>
mutate(percentage = lp(packages/sum(packages)))| total_attempts > total_accepted | packages | percentage |
|---|---|---|
| FALSE | 15792 | 99.1% |
| TRUE | 145 | 0.9% |
Close to 1% require more than double submissions per version.
Last we can see the overall experience for developers:
fs <- count_submissions(accepted_subm)

ggplot(fs) +
  geom_abline(slope = 1, intercept = 0, linetype = 2) +
  geom_count(aes(total_accepted, total_attempts)) +
  geom_label_repel(aes(total_accepted, total_attempts, label = package),
                   data = . %>% filter(total_attempts >= 12)) +
  labs(x = "CRAN versions", y = "Rejected submissions",  size = "Packages",
       title = "All packages submissions", subtitle = "for the period analyzed ~174 weeks") +
  theme_minimal() +
  scale_size(trans = "log10") +
  theme(legend.position = c(0.8, 0.7), legend.background = element_rect())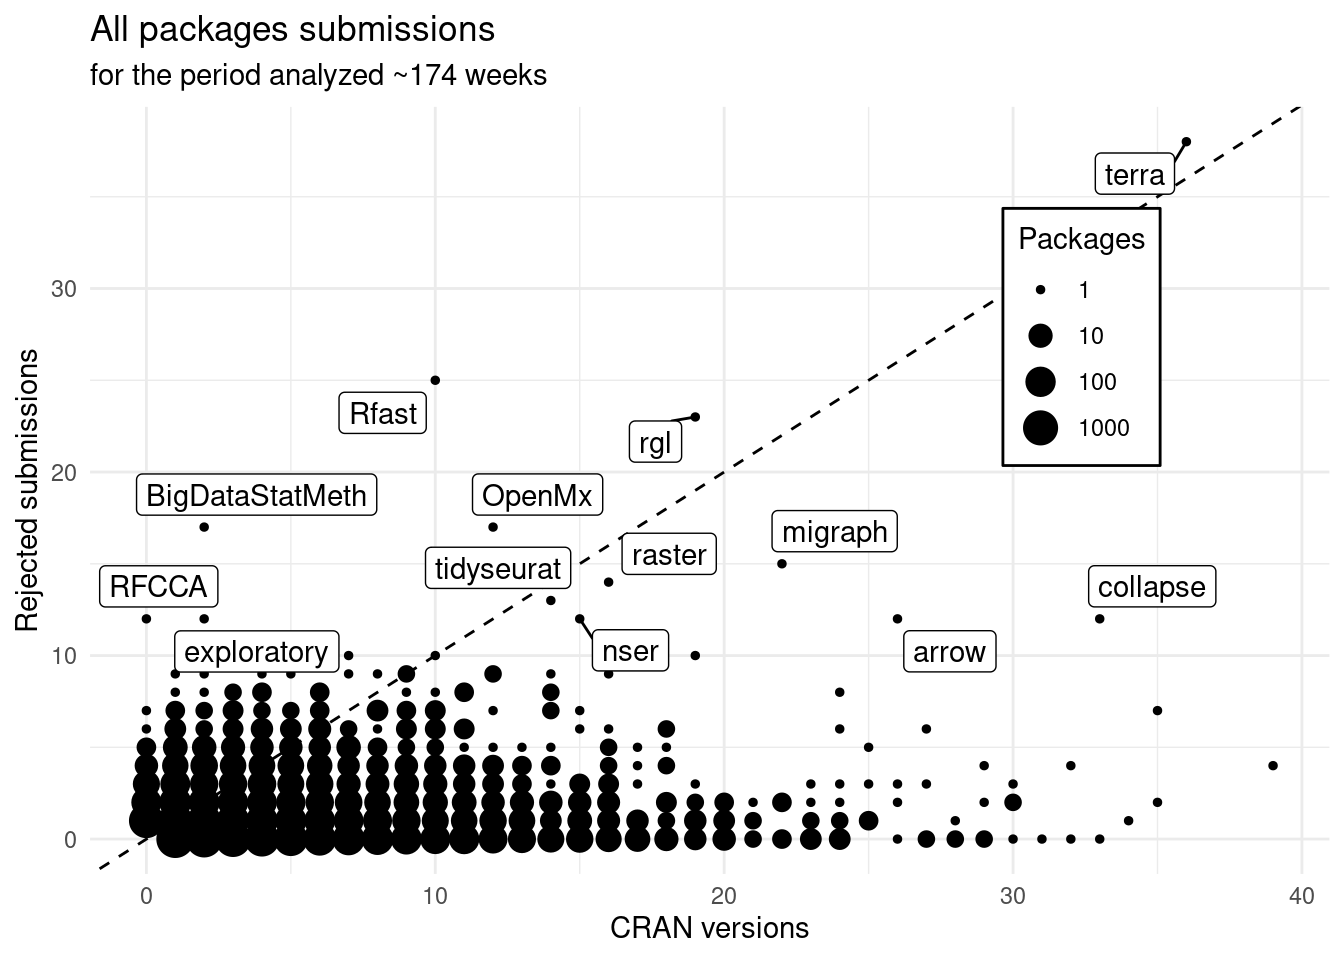
It doesn’t change much between the experienced. Note that this only add the packages that were not approved ever and the submissions done to be first accepted. So the changes should only be observable on the bottom left corner of the plot.
Overall, 14.5% of the attempts end up being rejected.
Main take away
Submitting to CRAN is not easy on the first try, and it usually requires 2 submissions for each accepted version.
While Writing R extensions document is clear, it might be too extensive for many cases.
The CRAN policy is short but might not be clear enough for new maintainers.
A document in the middle might be R packages but it is still extensive and focused on only a small opionated set of packages.
A CRAN Task View or some training might be a good solution to reduce the overall problem.
For those maintainers struggling, maybe clearer technical or editorial decisions might be a good solution.
In addition, it seems that packages having more problems with the submissions are not new: experienced maintainers have troubles getting their package accepted when submitting them.
This might hint to troubles replicating the CRAN checks or environments or the scale of the checks (dependency checks).
Maybe focusing on helping those packages’ maintainer might provide a good way to help CRAN maintainers reduce their load.
I also want to comment that this analysis could be improved if we knew, whether the rejection was automatic or manual.
This would allow to see the burden on CRAN volunteers and perhaps define better the problem and propose better solutions.
It could be attempted by looking the last folder of a package in the submission process, but it would still not be clear what the most frequent problem is.
Bonus
From all the new packages more than half are already archived (with either newer versions or totally):
accepted_subm |>
  filter(acceptance_n == 1L) |>
  count(status = type, name = "packages") |>
mutate(percentage = lp(packages/sum(packages)))| status | packages | percentage |
|---|---|---|
| archived | 4763 | 65.4% |
| available | 2517 | 34.6% |
Of them:
fully_archived <- accepted_subm |>
  filter(acceptance_n != 0L) |>
  filter(any(acceptance_n == 1L), .by = package) |>
  summarize(archived = all(type == "archived"), .by = package) |>
  count(archived, name = "packages") |>
  mutate(percentage = lp(packages/sum(packages)))
fully_archived| archived | packages | percentage |
|---|---|---|
| FALSE | 6783 | 93.2% |
| TRUE | 497 | 6.8% |
Only 6.8% of packages were fully archived at the end of this period 2020-09-12, 2024-01-20.
Reproducibility
## ─ Session info ───────────────────────────────────────────────────────────────────────────────────────────────────────
##  setting  value
##  version  R version 4.3.1 (2023-06-16)
##  os       Ubuntu 22.04.3 LTS
##  system   x86_64, linux-gnu
##  ui       X11
##  language (EN)
##  collate  en_US.UTF-8
##  ctype    en_US.UTF-8
##  tz       Europe/Madrid
##  date     2024-01-20
##  pandoc   3.1.1 @ /usr/lib/rstudio/resources/app/bin/quarto/bin/tools/ (via rmarkdown)
##
## ─ Packages ───────────────────────────────────────────────────────────────────────────────────────────────────────────
##  package     * version date (UTC) lib source
##  blogdown      1.18    2023-06-19 [1] CRAN (R 4.3.1)
##  bookdown      0.37    2023-12-01 [1] CRAN (R 4.3.1)
##  bslib         0.6.1   2023-11-28 [1] CRAN (R 4.3.1)
##  cachem        1.0.8   2023-05-01 [1] CRAN (R 4.3.1)
##  cli           3.6.2   2023-12-11 [1] CRAN (R 4.3.1)
##  colorspace    2.1-0   2023-01-23 [1] CRAN (R 4.3.1)
##  digest        0.6.33  2023-07-07 [1] CRAN (R 4.3.1)
##  dplyr       * 1.1.4   2023-11-17 [1] CRAN (R 4.3.1)
##  evaluate      0.23    2023-11-01 [1] CRAN (R 4.3.2)
##  fansi         1.0.6   2023-12-08 [1] CRAN (R 4.3.1)
##  farver        2.1.1   2022-07-06 [1] CRAN (R 4.3.1)
##  fastmap       1.1.1   2023-02-24 [1] CRAN (R 4.3.1)
##  generics      0.1.3   2022-07-05 [1] CRAN (R 4.3.1)
##  ggplot2     * 3.4.4   2023-10-12 [1] CRAN (R 4.3.1)
##  ggrepel     * 0.9.5   2024-01-10 [1] CRAN (R 4.3.1)
##  glue          1.7.0   2024-01-09 [1] CRAN (R 4.3.1)
##  gtable        0.3.4   2023-08-21 [1] CRAN (R 4.3.1)
##  highr         0.10    2022-12-22 [1] CRAN (R 4.3.1)
##  htmltools     0.5.7   2023-11-03 [1] CRAN (R 4.3.2)
##  jquerylib     0.1.4   2021-04-26 [1] CRAN (R 4.3.1)
##  jsonlite      1.8.8   2023-12-04 [1] CRAN (R 4.3.1)
##  knitr       * 1.45    2023-10-30 [1] CRAN (R 4.3.2)
##  labeling      0.4.3   2023-08-29 [1] CRAN (R 4.3.2)
##  lifecycle     1.0.4   2023-11-07 [1] CRAN (R 4.3.2)
##  lubridate   * 1.9.3   2023-09-27 [1] CRAN (R 4.3.1)
##  magrittr      2.0.3   2022-03-30 [1] CRAN (R 4.3.1)
##  munsell       0.5.0   2018-06-12 [1] CRAN (R 4.3.1)
##  pillar        1.9.0   2023-03-22 [1] CRAN (R 4.3.1)
##  pkgconfig     2.0.3   2019-09-22 [1] CRAN (R 4.3.1)
##  purrr         1.0.2   2023-08-10 [1] CRAN (R 4.3.1)
##  R6            2.5.1   2021-08-19 [1] CRAN (R 4.3.1)
##  Rcpp          1.0.12  2024-01-09 [1] CRAN (R 4.3.1)
##  rlang         1.1.3   2024-01-10 [1] CRAN (R 4.3.1)
##  rmarkdown     2.25    2023-09-18 [1] CRAN (R 4.3.1)
##  rstudioapi    0.15.0  2023-07-07 [1] CRAN (R 4.3.1)
##  sass          0.4.8   2023-12-06 [1] CRAN (R 4.3.1)
##  scales        1.3.0   2023-11-28 [1] CRAN (R 4.3.1)
##  sessioninfo   1.2.2   2021-12-06 [1] CRAN (R 4.3.1)
##  tibble        3.2.1   2023-03-20 [1] CRAN (R 4.3.1)
##  tidyr       * 1.3.0   2023-01-24 [1] CRAN (R 4.3.1)
##  tidyselect    1.2.0   2022-10-10 [1] CRAN (R 4.3.1)
##  timechange    0.2.0   2023-01-11 [1] CRAN (R 4.3.1)
##  utf8          1.2.4   2023-10-22 [1] CRAN (R 4.3.2)
##  vctrs         0.6.5   2023-12-01 [1] CRAN (R 4.3.1)
##  withr         2.5.2   2023-10-30 [1] CRAN (R 4.3.2)
##  xfun          0.41    2023-11-01 [1] CRAN (R 4.3.2)
##  yaml          2.3.8   2023-12-11 [1] CRAN (R 4.3.1)
##
##  [1] /home/lluis/bin/R/4.3.1
##  [2] /opt/R/4.3.1/lib/R/library
##
## ──────────────────────────────────────────────────────────────────────────────────────────────────────────────────────