CRAN review
I’ve been doing some analysis on the review submissions of several projects of R. However, till recently I couldn’t analyze the CRAN submission. There was cransays’ package to check package submissions which on the online documentation provided a dashboard which updated each hour. Since 2020/09/12 the status of the queues and folders of submissions are saved on a branch. Using this information and basing in script provided by Tim Taylor I’ll check how are the submissions on CRAN handled.
I’ll look at the CRAN queue, I’ll explore some time patterns and also check the meaning of those subfolder. Later I’ll go to a more practical information for people submitting a package. Lastly, we’ll see how hard is the job of the CRAN team by looking at the reliability of the Github action used.
Before all this we need preliminary work to download the data and clean it:
# Downloading the cransays repository branch history
download.file("https://github.com/lockedata/cransays/archive/history.zip",
              destfile = "static/cransays-history.zip")
path_zip <- here::here("static", "cransays-history.zip")
# We unzip the files to read them
dat <- unzip(path_zip, exdir = "static")
csv <- dat[grepl("*.csv$", x = dat)]
f <- lapply(csv, read.csv)
m <- function(x, y) {
  merge(x, y, sort = FALSE, all = TRUE)
}
updates <- Reduce(m, f) # Merge all files (Because the file format changed)
write.csv(updates, file = "static/cran_till_now.csv",  row.names = FALSE)
# Clean up
unlink("static/cransays-history/", recursive = TRUE)
unlink("static/cransays-history.zip", recursive = TRUE)
Once we have the data we can load it, and we load the libraries used for the analysis:
library("tidyverse")
library("lubridate")
library("hms")
path_file <- here::here("static", "cran_till_now.csv")
cran_submissions <- read.csv(path_file)
theme_set(theme_minimal()) # For plotting
col_names <- c("package", "version", "snapshot_time", "folder", "subfolder")
cran_submissions <- cran_submissions[, col_names]
The period we are going to analyze is from the beginning of the records till 2021-01-30. It includes some well earned holiday time for the CRAN team, during which submissions were not possible.
I’ve read some comments on the inconsistencies of where the holidays of the CRAN teams are reported and I couldn’t find it for previous years.
For the 4 months we are analyzing which only has one holiday period I used a screenshot found on twitter.
holidays <- data.frame(
  start = as.POSIXct("18/12/2020", format = "%d/%m/%Y", tz = "UTC"),
  end = as.POSIXct("04/01/2021", format = "%d/%m/%Y", tz = "UTC")
)
Now that we know the holidays and have them in a single data.frame it’s time to explore and clean the data collected:
Cleaning the data
After preparing the files in one big file we can load and work with it. First steps, check the data and prepare it for what we want:
# Use appropriate class
cran_submissions$snapshot_time <- as.POSIXct(cran_submissions$snapshot_time,
                                             tz = "UTC")
# Fix subfolders structure
cran_submissions$subfolder[cran_submissions$subfolder %in% c("", "/")] <- NA
# Remove files or submissions without version number
cran_submissions <- cran_submissions[!is.na(cran_submissions$version), ]
cran_submissions <- distinct(cran_submissions,
                             snapshot_time, folder, package, version, subfolder,
                             .keep_all = TRUE)
After loading and a preliminary cleanup, set date format, homogenize folder format, remove submissions that are not packages (yes there are pdf and other files on the queue), and remove duplicates we can start.
As always start with some checks of the data. Note: I should follow more often this advice myself, as this is the last section I’m writing on the post.
packges_multiple_versions <- cran_submissions %>%
  group_by(package, snapshot_time) %>%
  summarize(n = n_distinct(version)) %>%
  filter(n != 1) %>%
  distinct(package) %>%
  pull(package)
There are 92 packages with multiple versions at the same time on CRAN queue.
Perhaps because packages are left in different folders (2 or even 3) at the same time:
package_multiple <- cran_submissions %>%
  group_by(snapshot_time, package) %>%
  count() %>%
  group_by(snapshot_time) %>%
  count(n) %>%
  filter(n != 1) %>%
  summarise(n = sum(nn)) %>%
  ungroup()
ggplot(package_multiple) +
  geom_point(aes(snapshot_time, n), size = 1) +
  geom_rect(data = holidays, aes(xmin = start, xmax = end, ymin = 0, ymax = 6),
            alpha = 0.25, fill = "red") +
  annotate("text", x = holidays$start + (holidays$end - holidays$start)/2,
           y = 3.5, label = "CRAN holidays") +
  scale_x_datetime(date_labels = "%Y/%m/%d", date_breaks = "2 weeks",
                   expand = expansion()) +
  scale_y_continuous(expand = expansion()) +
  labs(title = "Packages in multiple folders and subfolders",
       x = element_blank(), y = element_blank())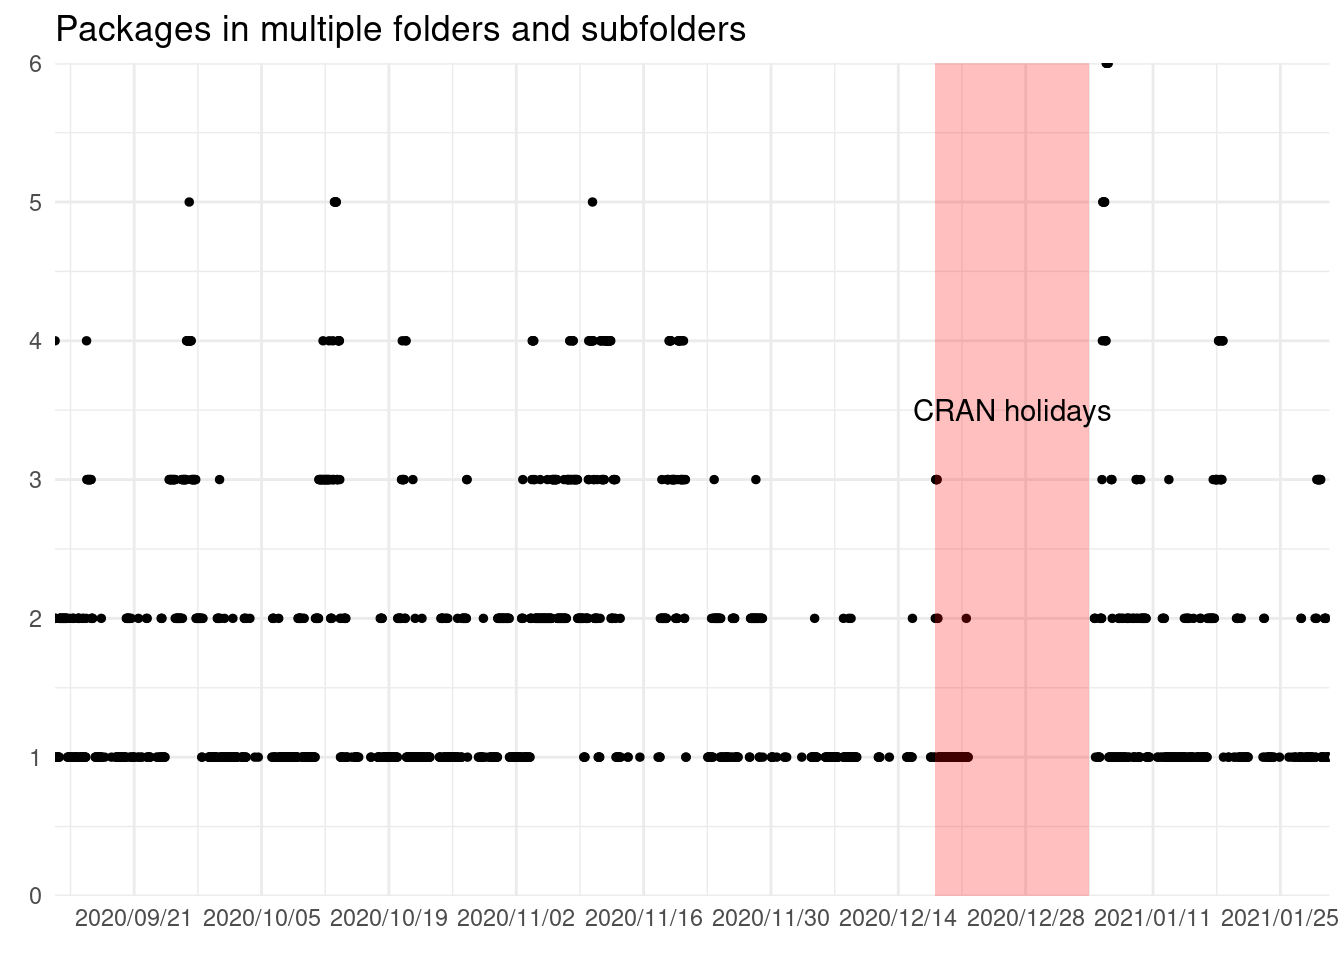
This happens in 1915 snapshots of 3260, probably due to the manual labor of the CRAN reviews. I don’t really know the cause of this, it could be an error on the script recording the data, copying the data around the server. But perhaps this indicates further improvements and automatization of the process can be done.
cran_submissions <- cran_submissions %>%
  arrange(package, snapshot_time, version, folder) %>%
  group_by(package, snapshot_time) %>%
  mutate(n = 1:n()) %>%
  filter(n == n()) %>%
  ungroup() %>%
  select(-n)
Now we removed ~3500 records of packages with two versions remaining on the queue. Next we check packages in multiple folders but with the same version and remove them until we are left with a single one (assuming there aren’t parallel steps on the review process followed):
cran_submissions <- cran_submissions %>%
  arrange(package, snapshot_time, folder) %>%
  group_by(package, snapshot_time) %>%
  mutate(n = 1:n()) %>%
  filter(n == n()) %>%
  ungroup() %>%
  select(-n)
Last, we add the number of submissions, in this period, for each package:
diff0 <- structure(0, class = "difftime", units = "hours")
cran_submissions <- cran_submissions %>%
  arrange(package, version, snapshot_time) %>%
  group_by(package) %>%
  # Packages last seen in queue less than 24 ago are considered same submission
  mutate(diff_time = difftime(snapshot_time,  lag(snapshot_time), units = "hour"),
         diff_time = if_else(is.na(diff_time), diff0, diff_time), # Fill NAs
         diff_v = version != lag(version),
         diff_v = ifelse(is.na(diff_v), TRUE, diff_v), # Fill NAs
         new_version = !near(diff_time, 1, tol = 24) & diff_v,
         new_version = if_else(new_version == FALSE & diff_time == 0,
                               TRUE, new_version),
         submission_n = cumsum(as.numeric(new_version))) %>%
  ungroup() %>%
  select(-diff_time, -diff_v, -new_version)
As sometimes after a release there is soon a fast update to fix some bugs raised on the new features introduced, if a package isn’t seen in 24h in the queue it is considered a new submission. Also if it change the package version but not if it change the version while addressing the feedback from reviewers.
Now we have the data ready for further analysis.
CRAN load
We all know that CRAN is busy with updates to fix bugs, improve package, or with petitions to have new packages included on the repository.
A first plot we can make is showing the number of distinct packages on each moment:
cran_queue <- cran_submissions %>%
  group_by(snapshot_time) %>%
  summarize(n = n_distinct(package))
ggplot(cran_queue) +
  geom_rect(aes(xmin = start, xmax = end, ymin = 0, ymax = 230),
            alpha = 0.5, fill = "red", data = holidays) +
  annotate("text", x = holidays$start + (holidays$end - holidays$start)/2,
           y = 150, label = "CRAN holidays") +
  geom_path(aes(snapshot_time, n)) +
  scale_x_datetime(date_labels = "%Y/%m/%d", date_breaks = "2 weeks",
                   expand = expansion()) +
  scale_y_continuous(expand = expansion()) +
  labs(x = element_blank(), y = element_blank(),
       title = "Packages on CRAN review process")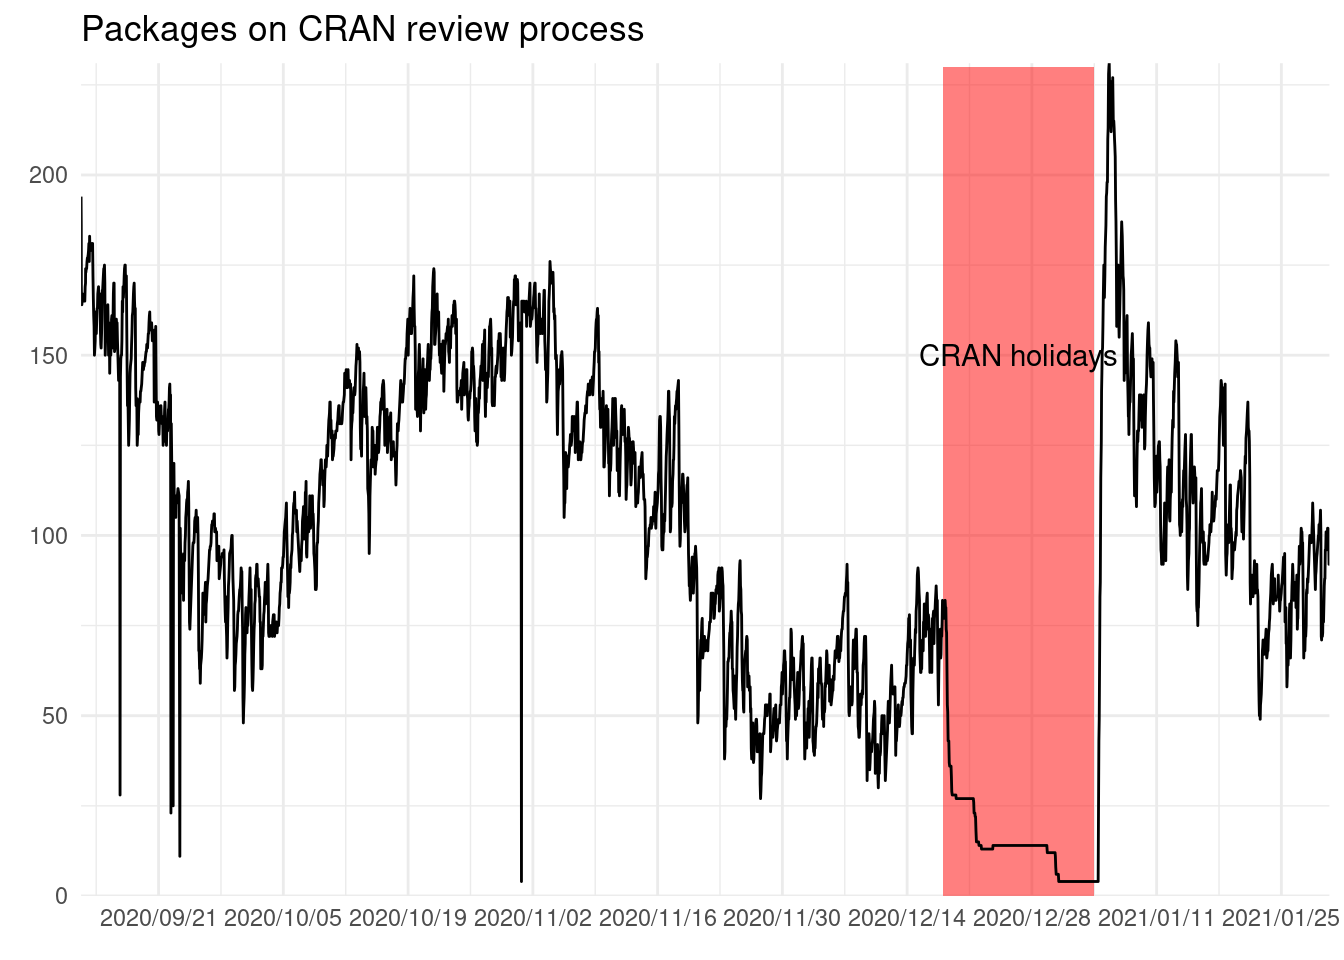
We can see that there are some ups and downs, and ranges between 200 to 50.
There are some instance were the number of package on the queue have a sudden drop and then a recovery to previous levels. This as far as I know is a visual artifact.
We can also see that people do not tend to rush and push the package before the holidays. But clearly there is some build up of submissions after holidays, as the the highest number of packages on the queue is reached after holidays.
On the CRAN review process classifying package in folders seems to be part of the process:
man_colors <- RColorBrewer::brewer.pal(8, "Dark2")
names(man_colors) <- unique(cran_submissions$folder)
cran_submissions %>%
  group_by(folder, snapshot_time) %>%
  summarize(packages = n_distinct(package)) %>%
  ggplot() +
  geom_rect(data = holidays, aes(xmin = start, xmax = end, ymin = 0, ymax = 200),
            alpha = 0.25, fill = "red") +
  annotate("text", x = holidays$start + (holidays$end - holidays$start)/2,
           y = 105, label = "CRAN holidays") +
  geom_path(aes(snapshot_time, packages, col = folder)) +
  scale_x_datetime(date_labels = "%Y/%m/%d", date_breaks = "2 weeks",
                   expand = expansion()) +
  scale_y_continuous(expand = expansion()) +
  scale_color_manual(values = man_colors) +
  labs(x = element_blank(), y = element_blank(),
       title = "Packages by folder", col = "Folder") +
  theme(legend.position = c(0.6, 0.7))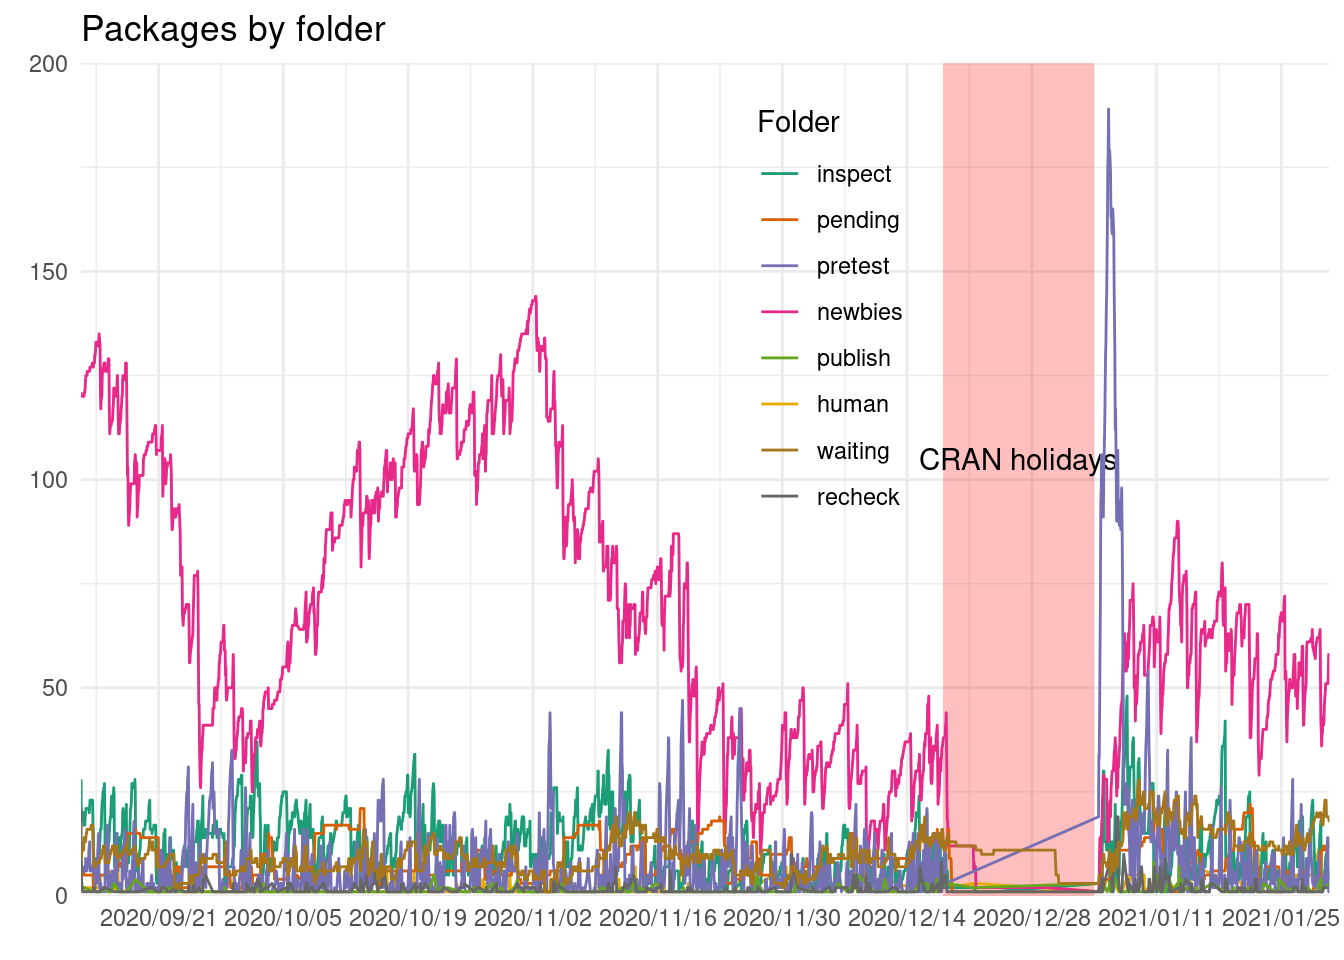
The queue trend is mostly driven by newbies folder (which ranges between 25 and 150) and after holidays by the pretest folder.
Surprisingly when the queue is split by folder we don’t see those sudden drops. This might indicate that there is a clean up on some of the folders1. What we clearly see is a clean up on holidays for all the folders, when almost all was cleared up.
Also the pretest seems to be before the newbies folder raises, so it seems like these tests are done done only to new pacakges.
There other folders do not have such an increaseafter the holidays .
cran_submissions %>%
  group_by(folder, snapshot_time) %>%
  summarize(packages = n_distinct(package)) %>%
  filter(snapshot_time >= holidays$start) %>%
  ggplot() +
  geom_path(aes(snapshot_time, packages, col = folder)) +
  geom_rect(data = holidays, aes(xmin = start, xmax = end, ymin = 0, ymax = 200),
            alpha = 0.25, fill = "red") +
  annotate("text", x = holidays$start + (holidays$end - holidays$start)/2,
           y = 105, label = "CRAN holidays") +
  scale_x_datetime(date_labels = "%Y/%m/%d", date_breaks = "1 day",
                   expand = expansion()) +
  scale_y_continuous(expand = expansion(), limits = c(0, NA)) +
  scale_color_manual(values = man_colors) +
  labs(x = element_blank(), y = element_blank(),
       title = "Holidays", col = "Folder") +
  theme(axis.text.x = element_text(angle = 45, hjust = 1),
        legend.position = c(0.8, 0.7))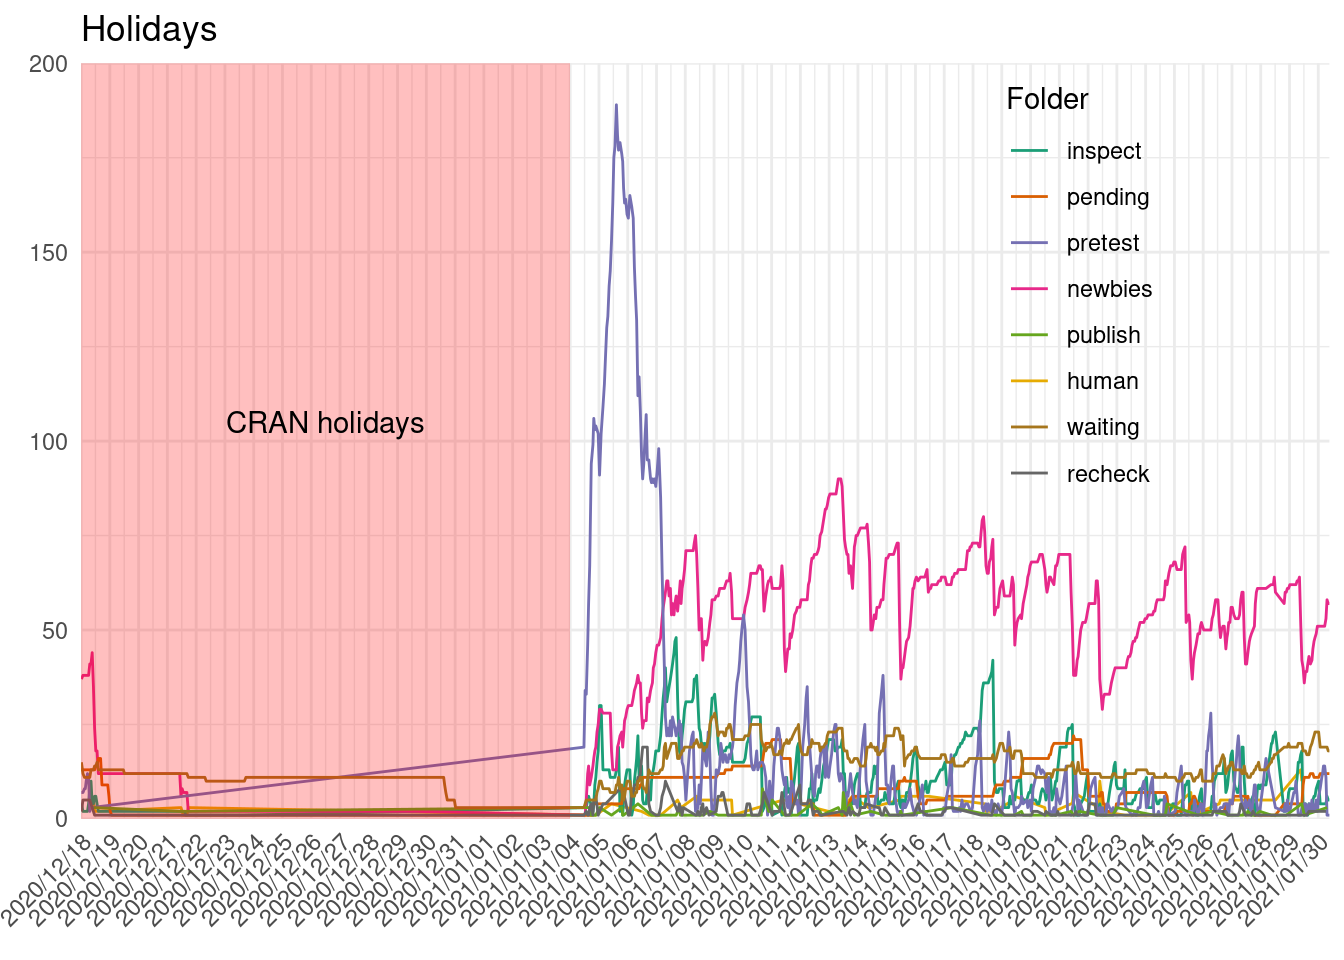
It seems like that on the 31st there was a clean up of some packages on the waiting list. And we can see the increase of submissions on the first week of January, as described previously.
Time patterns
Some people has expressed they try to submit to CRAN when there are few packages on the queue. Thus, looking when does this low moments happens could be relevant. We can look for patterns on the queue:
Note: I have few to none experience with time series, so the following plots are just using the defaults of `geom_smooth`, just omitting the holidays.
By day of the month
Looking at folder:
cran_times <- cran_submissions %>%
  mutate(seconds = seconds(snapshot_time),
         month = month(snapshot_time),
         mday = mday(snapshot_time),
         wday = wday(snapshot_time, locale = "en_GB.UTF-8"),
         week = week(snapshot_time),
         date = as_date(snapshot_time))
cran_times %>%
  arrange(folder, date, mday) %>%
  filter(snapshot_time < holidays$start | snapshot_time  > holidays$end) %>%
  group_by(folder, date, mday) %>%
  summarize(packages = n_distinct(package),
            week = unique(week)) %>%
  group_by(folder, mday) %>%
  ggplot() +
  geom_smooth(aes(mday, packages, col = folder)) +
  labs(x = "Day of the month", y = "Packages", col = "Folder",
       title = "Evolution by month day") +
  scale_color_manual(values = man_colors) +
  coord_cartesian(ylim = c(0, NA), xlim = c(1, NA)) +
  scale_x_continuous(expand = expansion()) +
scale_y_continuous(expand = expansion()) 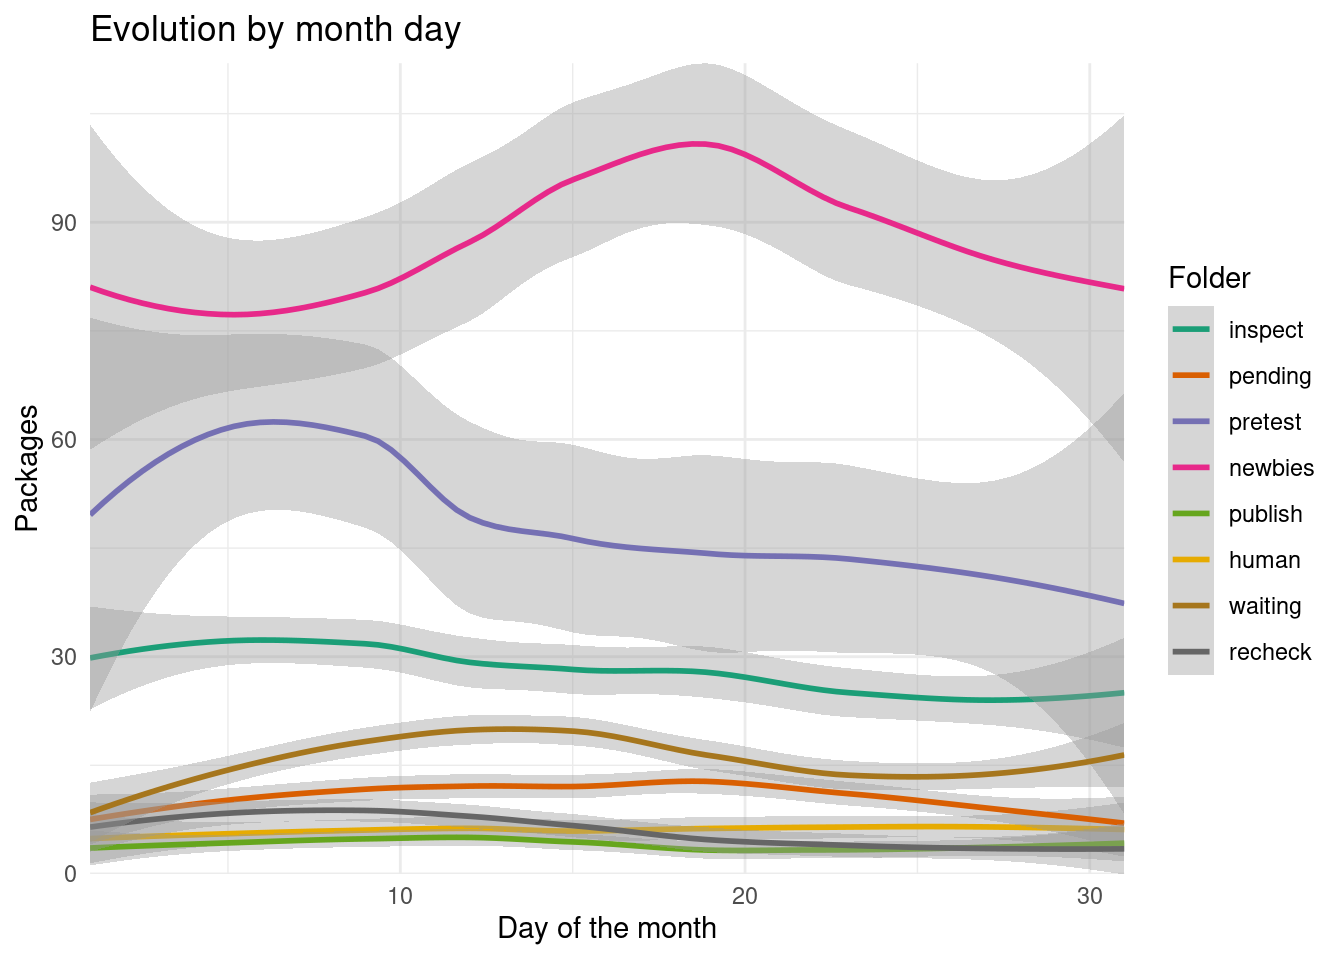
At the beginning and end of the month there is more variation on several folders (This could also be that there isn’t information of the end of December and beginning of January). There seems to be an increase of new packages submissions towards the beginning of the month and later and increase on the newbies folder by the middle of the month.
By day of the week
I first thought about this, because I was curious if there is more submission on weekends (when aficionados and open source developers might have more time) or the rest of the week.
cran_times %>%
  filter(snapshot_time < holidays$start | snapshot_time  > holidays$end) %>%
  group_by(folder, date, wday) %>%
  summarize(packages = n_distinct(package),
            week = unique(week)) %>%
  group_by(folder, wday) %>%
  ggplot() +
  geom_smooth(aes(wday, packages, col = folder)) +
  labs(x = "Day of the week", y = "Packages", col = "Folder",
       title = "Evolution by week day") +
  scale_color_manual(values = man_colors) +
  scale_x_continuous(breaks = 1:7, expand = expansion()) +
  scale_y_continuous(expand = expansion(), limits = c(0, NA))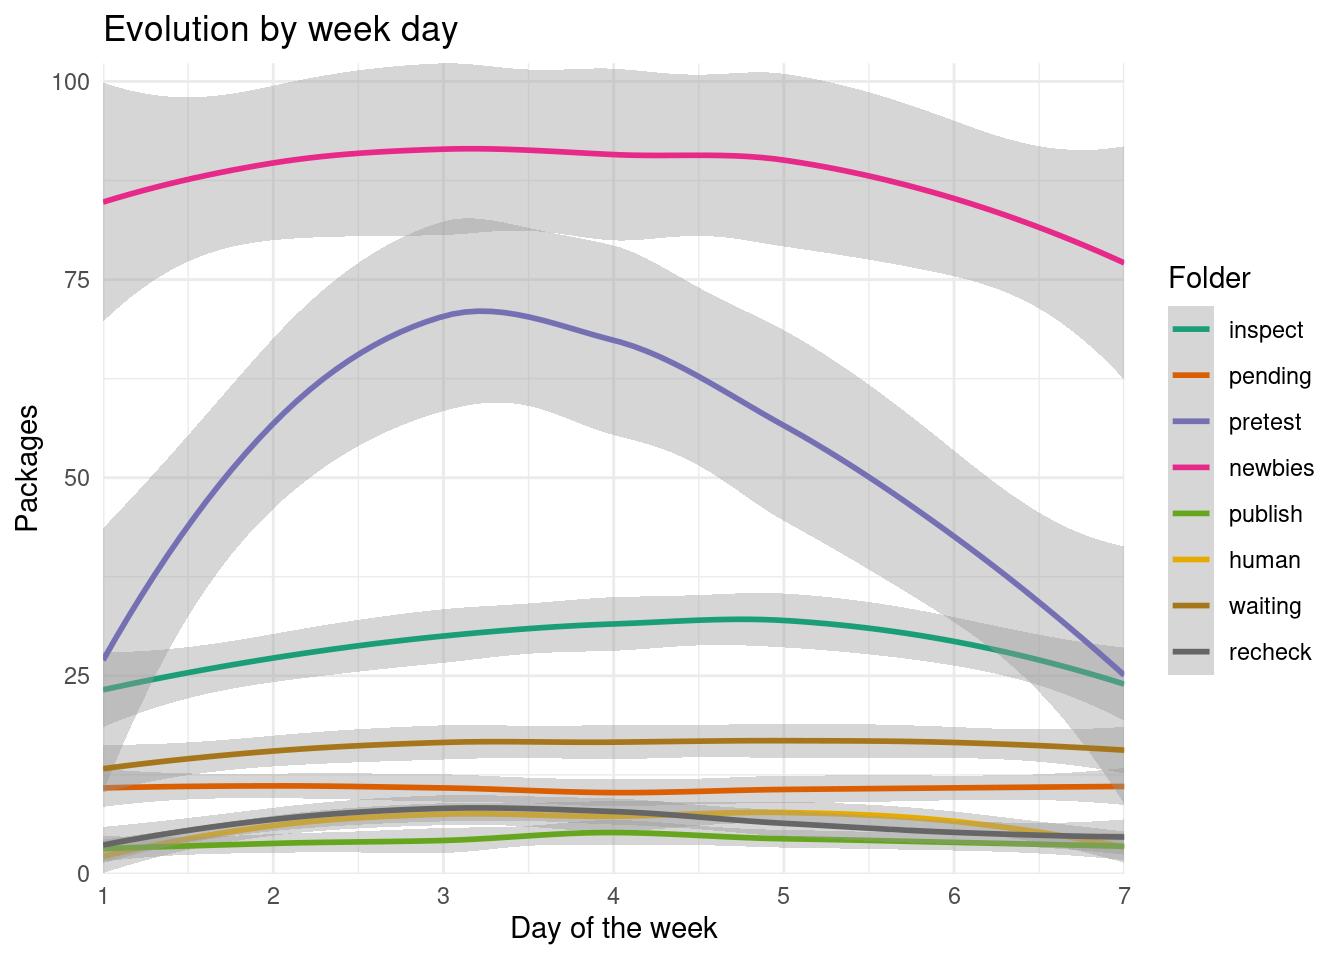
We see a rise towards the middle of the week of the packages on the pretest folder, indicating new packages submissions.
Other folders
There are some folders that seem to be from R Contributors. We see that some packages are on these folders:
cran_members <- c("LH", "GS", "JH")
cran_times %>%
  filter(subfolder %in% cran_members) %>%
  group_by(subfolder, snapshot_time) %>%
  summarize(packages = n_distinct(package)) %>%
  ggplot() +
  geom_smooth(aes(snapshot_time, packages, col = subfolder)) +
    labs(x = element_blank(), y = element_blank(), col = "Folder",
       title = "Packages on folders") +
  scale_y_continuous(expand = expansion(), breaks = 0:10) +
  coord_cartesian(y = c(0, NA))  +
  scale_x_datetime(date_labels = "%Y/%m/%d", date_breaks = "2 weeks",
               expand = expansion(add = 2)) +
  theme(legend.position = c(0.1, 0.8))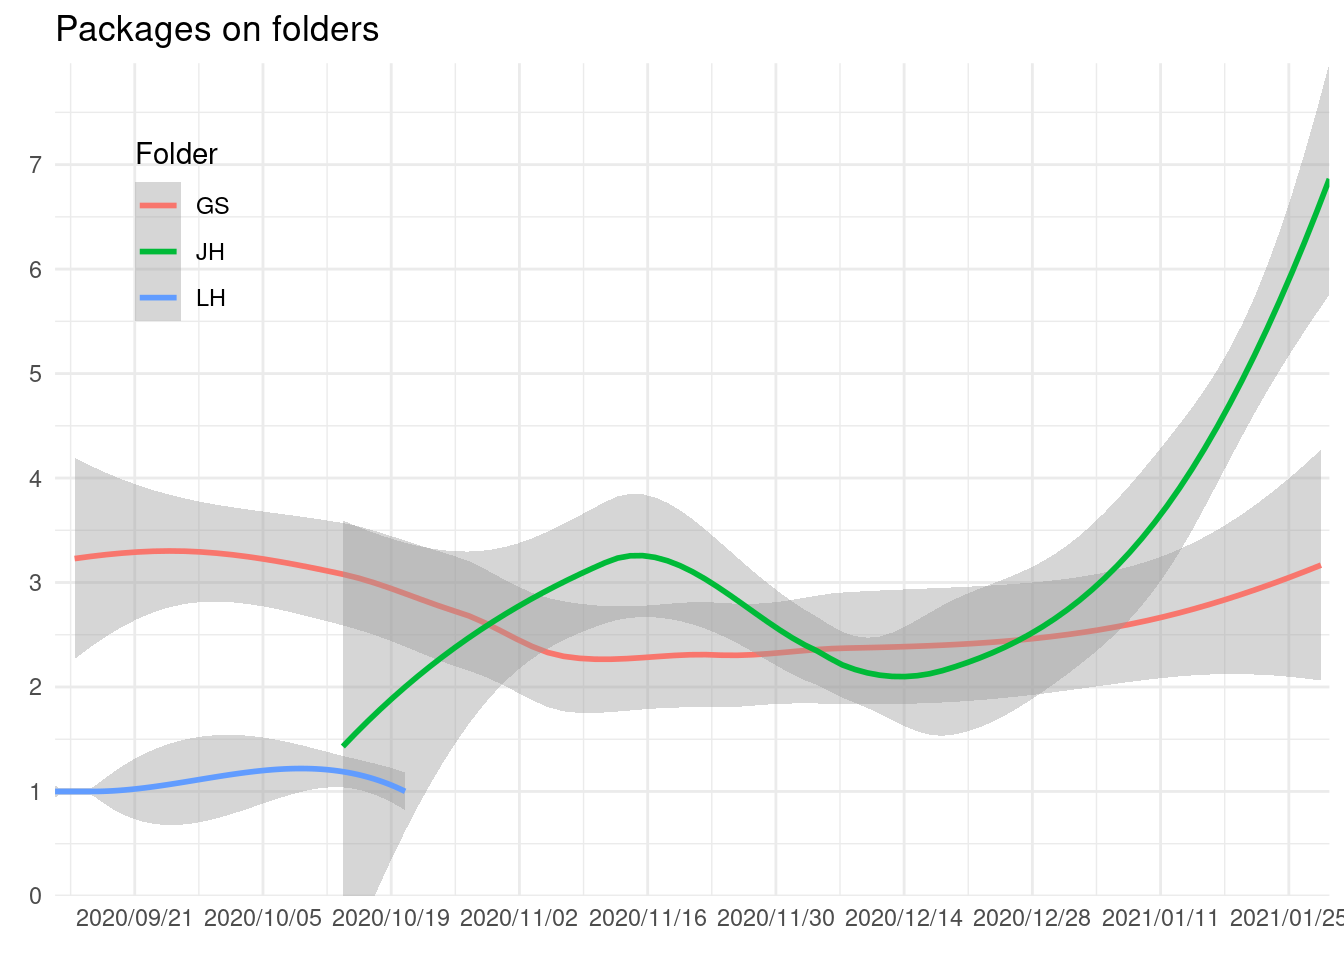
There doesn’t seem to be any rule about using those folders or, the work was so quick that the hourly updated data didn’t record it.
Looking for any temporal pattern on those folders isn’t worth it.
cran_times %>%
  filter(subfolder %in% cran_members) %>%
  group_by(subfolder, mday) %>%
  summarize(packages = n_distinct(package)) %>%
  ungroup() %>%
  ggplot() +
  geom_smooth(aes(mday, packages, col = subfolder)) +
  labs(x = "Day of the month", y = "Pacakges", col = "Subfolder",
       title = "Packages on subfolers by day of the month") +
  scale_y_continuous(expand = expansion()) +
  scale_x_continuous(expand = expansion(), breaks = c(1,7,14,21,29)) +
  coord_cartesian(ylim = c(0, NA))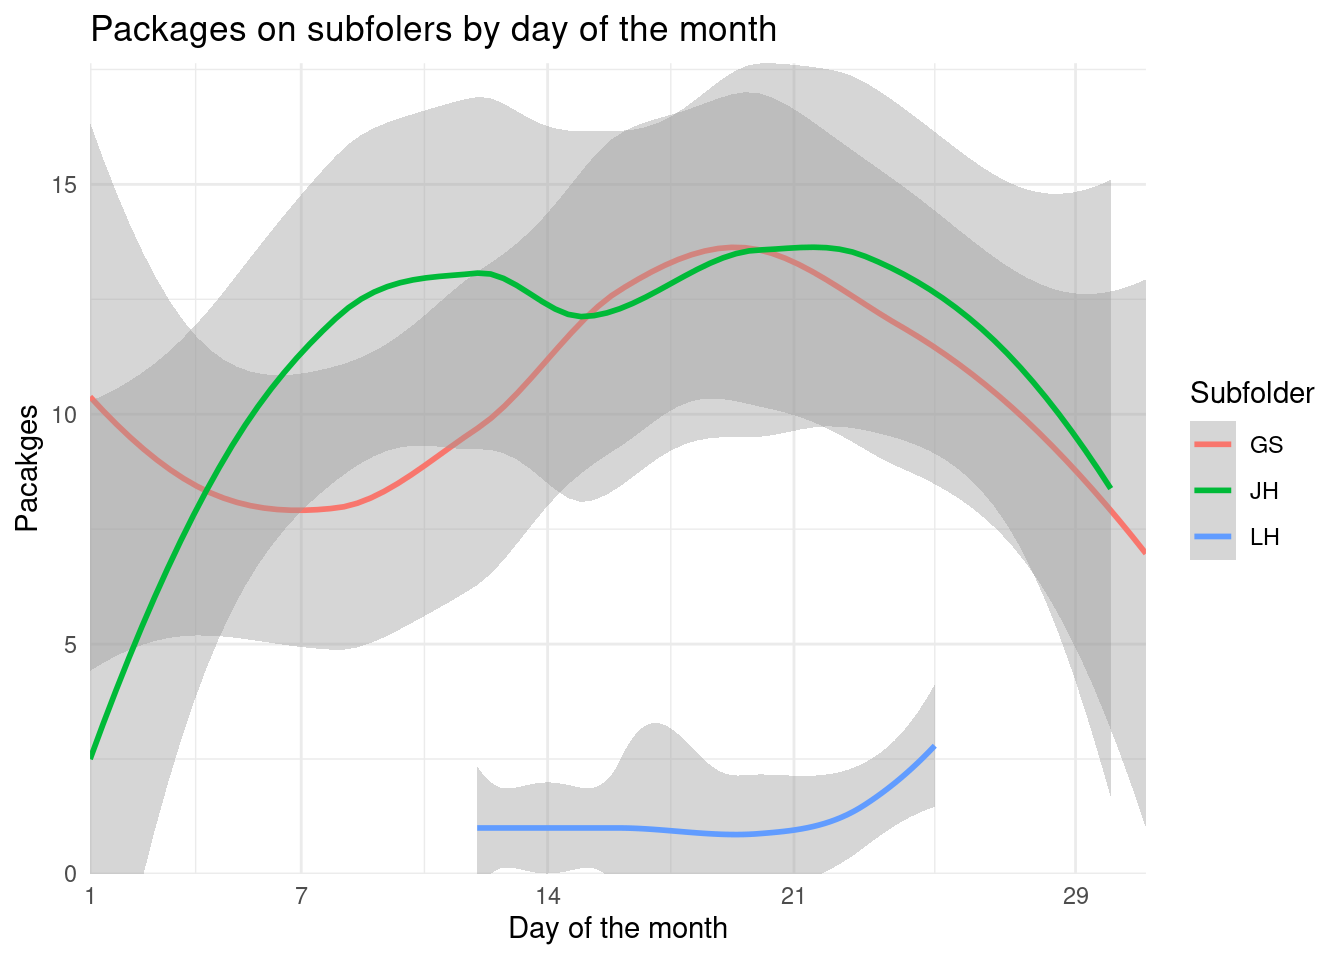
Low number of packages and great variability (except on those that just have 1 package on the folder) on day of month.
cran_times %>%
  filter(subfolder %in% cran_members) %>%
  group_by(subfolder, wday) %>%
  summarize(packages = n_distinct(package)) %>%
  ungroup() %>%
  ggplot() +
  geom_smooth(aes(wday, packages, col = subfolder)) +
  labs(x = "Day of the week", y = "Pacakges", col = "Subfolder",
       title = "Evolution by week day") +
  scale_y_continuous(expand = expansion()) +
  scale_x_continuous(breaks = 1:7, expand = expansion()) +
  coord_cartesian(ylim =  c(0, NA))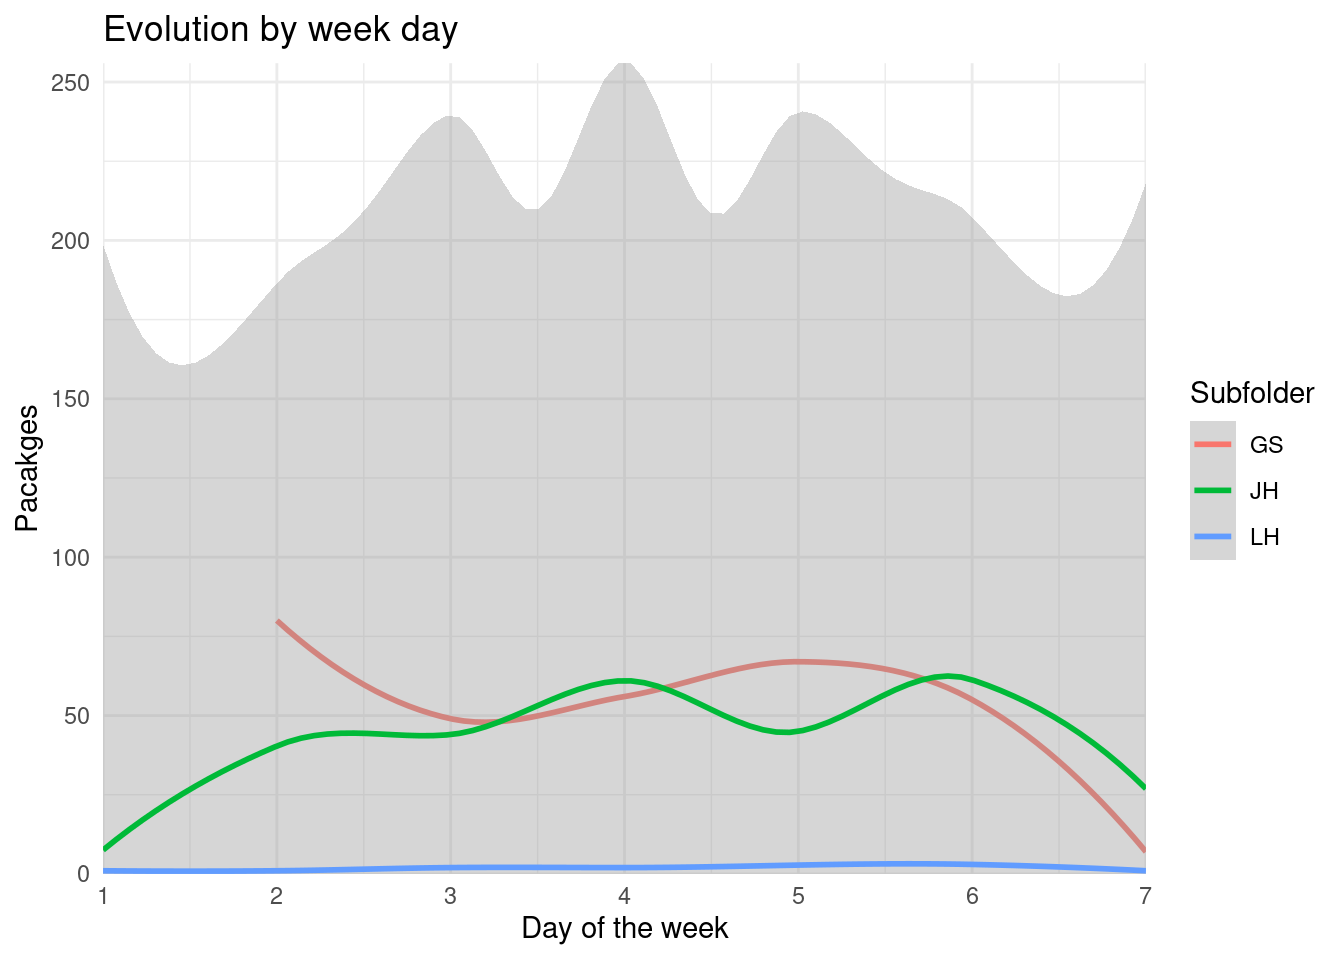
There seem to be only 2 people usually working with their folders. Suppose that there aren’t a common set of rules the reviewers follow.
Information for submitters
I’ve read lots of comments recently around CRAN submission. However, with the few data available compared to open reviews on Bioconductor and rOpenSci it is hard to answer them (See those related posts). On Bioconductor and rOpenSci it is possible to see people involved, message from the reviewers and other interested parties, steps done to be accepted…
One of the big question we can provide information about with the data available is how long it will be a package on the queue:
subm <- cran_times %>%
  arrange(snapshot_time) %>%
  select(package, version, submission_n, snapshot_time) %>%
  group_by(package, submission_n) %>%
  filter(row_number() %in% c(1, last(row_number()))) %>%
  arrange(package, submission_n)
There are 429 packages that are only seen once. It might mean that it is an abandoned, delayed or rejected submissions, other might be acceptances in less than an hour2.
If we look at the package submission by date we can see the quick increase of packages of packages:
rsubm <- subm %>%
  filter(n_distinct(snapshot_time) %% 2 == 0) %>%
  select(-version) %>%
  mutate(time = c("start", "end")) %>%
  pivot_wider(values_from = snapshot_time, names_from = time) %>%
  ungroup() %>%
  mutate(r = row_number(),
         time  =  round(difftime(end, start, units = "hour"), 0)) %>%
  ungroup()
lv <- levels(fct_reorder(rsubm$package, rsubm$start, .fun = min, .desc = FALSE))
ggplot(rsubm) +
  geom_rect(data = holidays, aes(xmin = start, xmax = end),
            ymin = first(lv), ymax = last(lv), alpha = 0.5, fill = "red") +
  geom_linerange(aes(y = fct_reorder(package, start, .fun = min, .desc = FALSE),
                      x = start, xmin = start, xmax = end,
                     col = as.factor(submission_n))) +
  labs(x = element_blank(), y = element_blank(), title =
         "Packages on the queue", col = "Submissions") +
  scale_x_datetime(date_labels = "%Y/%m/%d", date_breaks = "2 weeks",
                   expand = expansion(add = 2)) +
  scale_colour_viridis_d() +
  theme_minimal() +
  theme(panel.grid.major.y = element_blank(),
        axis.text.y = element_blank(),
        legend.position = c(0.15, 0.7))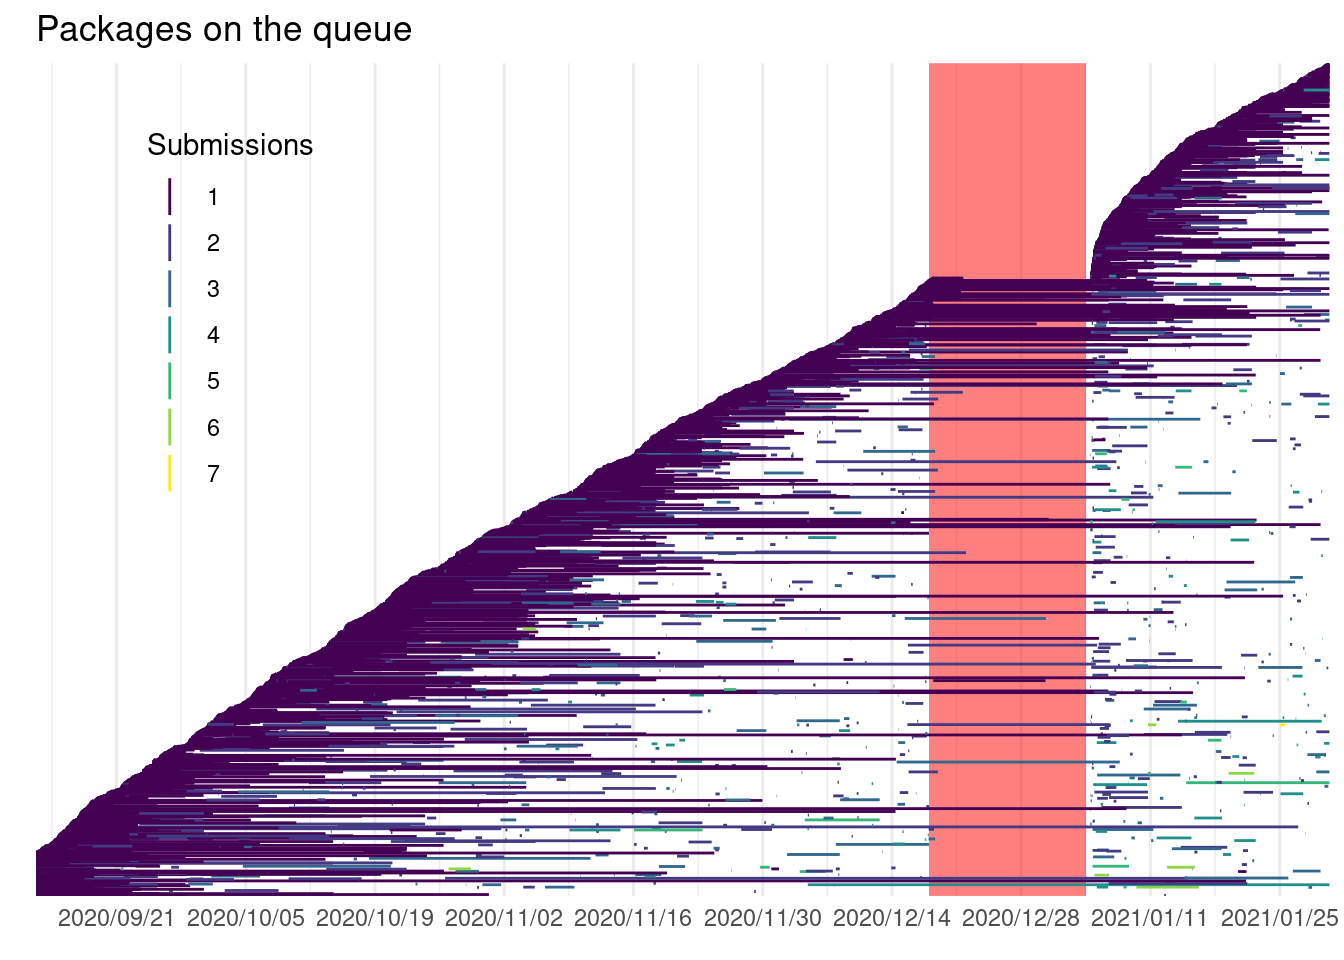
Some packages were submitted more than 5 times in this period. Recall the definition for submission used: a package with different version number after 24 hours or which wasn’t seen in the queue for the last 24 hours (even if they have the same version number).
Some authors do change the version number when CRAN reviewers require changes before accepting the package on CRAN while others do not and only change the version number according to their release cycle.
rsubm %>%
  arrange(start) %>%
  filter(start < holidays$start, # Look only before the holidays
    submission_n == 1,# Use only the first submission
    start > min(start)) %>%   # Just new submissions
  mutate(r = row_number(),
         start1 = as.numeric(seconds(start))) %>%
  lm(start1 ~ r, data = .) %>%
  broom::tidy() %>%
  mutate(estimate = estimate/(60*60)) # Hours
## # A tibble: 2 x 5
##   term         estimate std.error statistic p.value
##   <chr>           <dbl>     <dbl>     <dbl>   <dbl>
## 1 (Intercept) 444325.     6321.     253047.       0
## 2 r                1.03      4.76      779.       0
More or less there is a new package submission every hour on CRAN. Despite this submission rate we can see that most submissions are on the queue a short time:
library("patchwork")
p1 <- rsubm %>%
  group_by(package) %>%
  summarize(time = sum(time)) %>%
  ggplot() +
  geom_histogram(aes(time), bins = 100) +
  labs(title = "Packages total time on queue", x = "Hours",
       y = element_blank()) +
  scale_x_continuous(expand = expansion()) +
  scale_y_continuous(expand = expansion())
p2 <- rsubm %>%
  group_by(package) %>%
  summarize(time = sum(time)) %>%
  ggplot() +
  geom_histogram(aes(time), binwidth = 24) +
  coord_cartesian(xlim = c(0, 24*7)) +
  labs(subtitle = "Zoom", x = "Hours", y = element_blank()) +
  scale_x_continuous(expand = expansion(), breaks = seq(0, 24*7, by = 24)) +
  scale_y_continuous(expand = expansion()) +
  theme(panel.background = element_rect(colour = "white"))
p1 + inset_element(p2, 0.2, 0.2, 1, 1)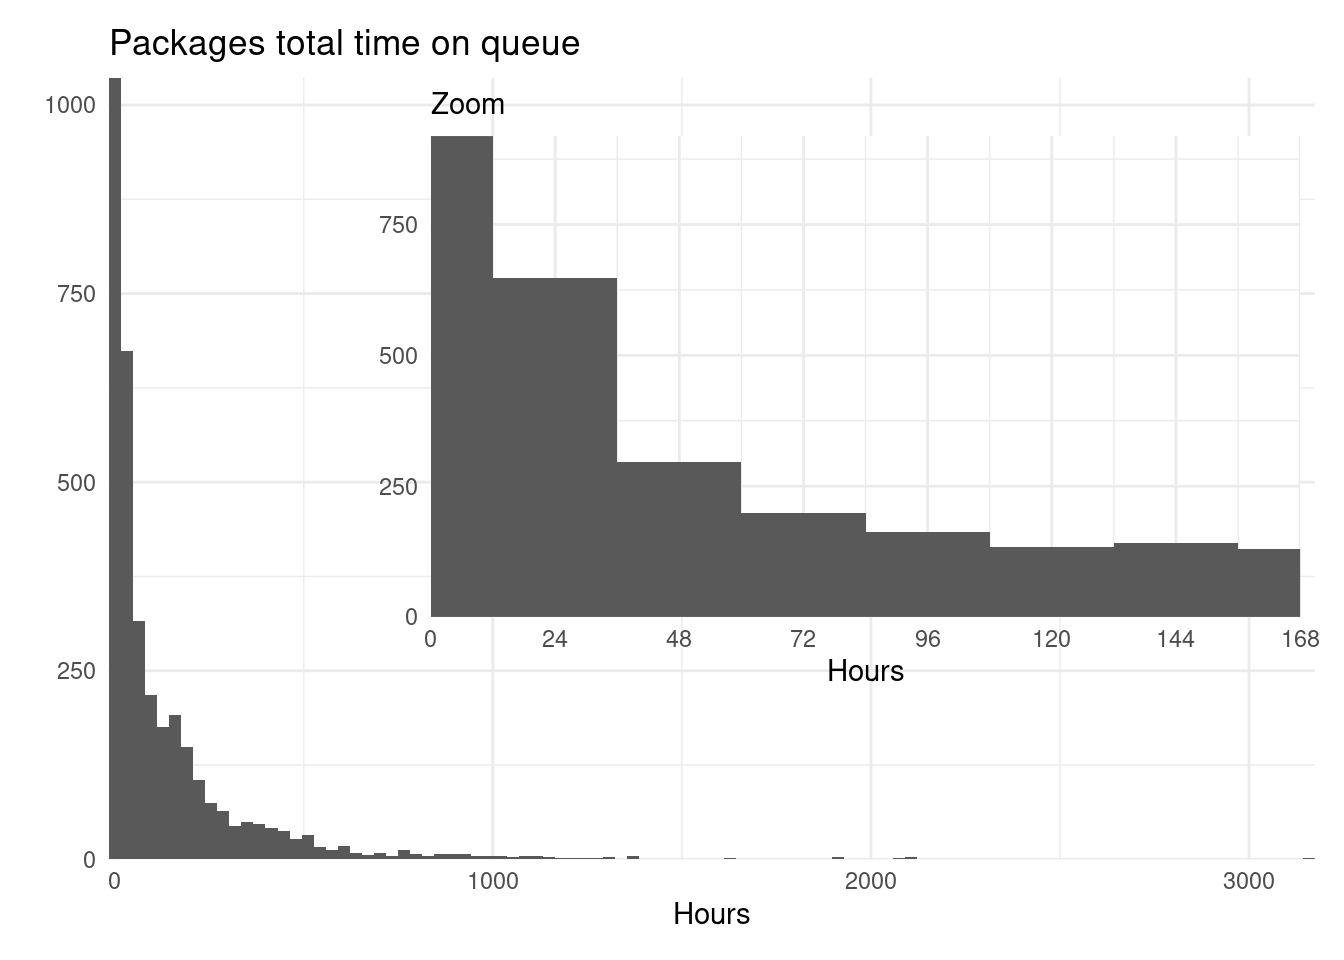
The accuracy of this data is not great. Because I found some packages that remained on the submission queue, and thus picked up by cransays, even after acceptance, so this might be a bit overestimated. Also, there are packages that got a speedy submission that didn’t last more than an hour, and they weren’t included.
Looking at the recorded submissions might be more accurate:
p1 <- rsubm %>%
  group_by(package, submission_n) %>%
  summarize(time = sum(time)) %>%
  ggplot() +
  geom_histogram(aes(time), bins = 100) +
  labs(title = "Submission time on queue", x = "Hours",
       y = element_blank()) +
  scale_x_continuous(expand = expansion()) +
  scale_y_continuous(expand = expansion())
p2 <- rsubm %>%
  group_by(package, submission_n) %>%
  summarize(time = sum(time)) %>%
  ggplot() +
  geom_histogram(aes(time), binwidth = 24) +
  coord_cartesian(xlim = c(0, 24*7)) +
  labs(subtitle = "Zoom", x = "Hours", y = element_blank()) +
  scale_x_continuous(expand = expansion(), breaks = seq(0, 24*7, by = 24)) +
  scale_y_continuous(expand = expansion()) +
  theme(panel.background = element_rect(colour = "white"))
p1 + inset_element(p2, 0.2, 0.2, 1, 1)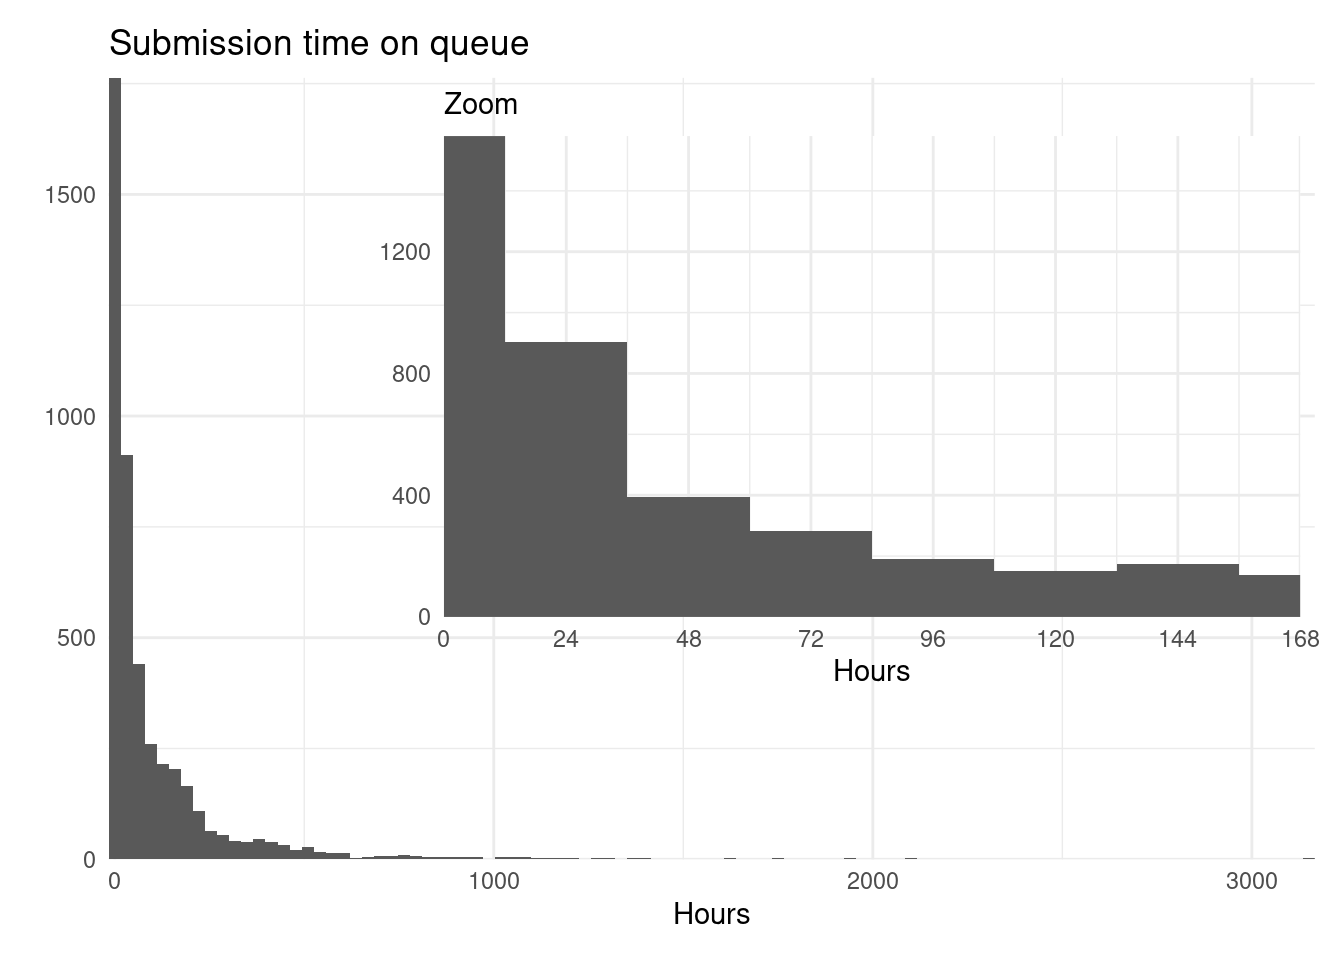
Many submissions are shortly spanned. Perhaps hinting that more testing should be done before or what to expect on the review should be more clear to the authors, or that they are approved very fast, or…
There are 429 packages that are only seen once. It might mean that it is an abandoned/rejected submissions other might be acceptances in less than an hour.
If we look at the folders of each submission well see different picture:
subm2 <- cran_times %>%
  group_by(package, submission_n, folder) %>%
  arrange(snapshot_time) %>%
  select(package, version, submission_n, snapshot_time, folder) %>%
  filter(row_number() %in% c(1, last(row_number()))) %>%
  arrange(submission_n)
rsubm2 <- subm2 %>%
  filter(n_distinct(snapshot_time) %% 2 == 0) %>%
  mutate(time = c("start", "end")) %>%
  pivot_wider(values_from = snapshot_time, names_from = time) %>%
  ungroup() %>%
  mutate(r = row_number(),
         time  =  round(difftime(end, start, units = "hour"), 0)) %>%
  ungroup() %>%
  filter(!is.na(start), !is.na(end))
lv <- levels(fct_reorder(rsubm2$package, rsubm2$start, .fun = min, .desc = FALSE))
ggplot(rsubm2) +
  geom_rect(data = holidays, aes(xmin = start, xmax = end),
            ymin = first(lv), ymax = last(lv), alpha = 0.5, fill = "red") +
  geom_linerange(aes(y = fct_reorder(package, start, .fun = min, .desc = FALSE),
                      x = start, xmin = start, xmax = end, col = folder)) +
  labs(x = element_blank(), y = element_blank(), title =
         "Packages on the queue") +
  scale_color_manual(values = man_colors) +
  scale_x_datetime(date_labels = "%Y/%m/%d", date_breaks = "2 weeks",
               expand = expansion(add = 2)) +
  labs(col = "Folder") +
  theme_minimal() +
  theme(panel.grid.major.y = element_blank(),
        axis.text.y = element_blank(),
        legend.position = c(0.2, 0.7))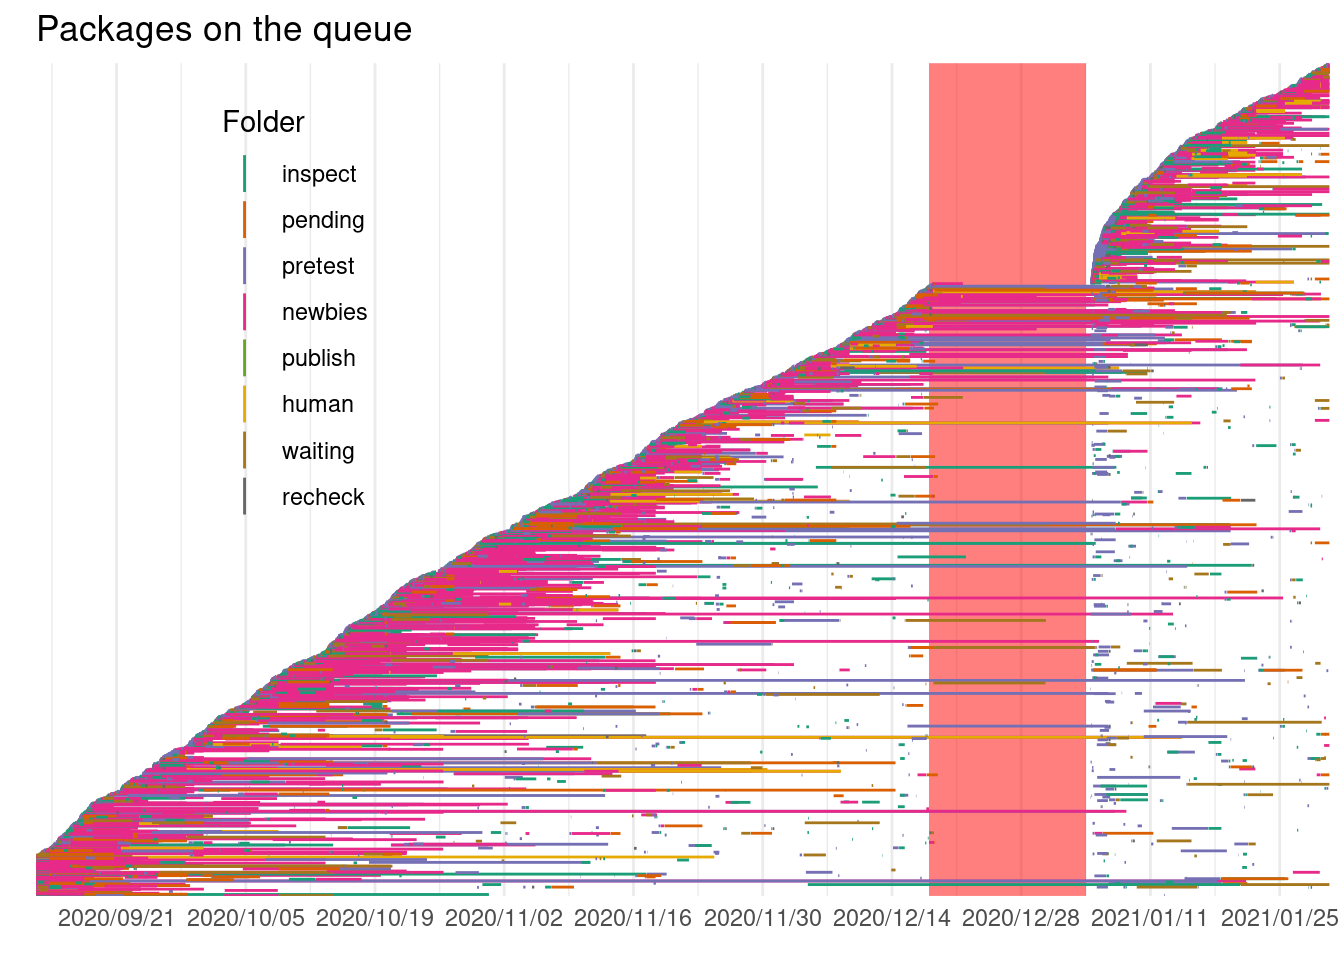
It looks like some packages take a long time to change folder, perhaps the maintainers have troubles fixing the issues pointed by the reviewers, or don’t have time to deal with them. Some packages are recorded in just 1 folder and some other go through multiple folders:
rsubm2 %>%
  group_by(package, submission_n) %>%
  summarize(n_folder = n_distinct(folder)) %>%
  ggplot() +
  geom_histogram(aes(n_folder), bins = 5) +
  labs(title = "Folders by submission", x = element_blank(),
       y = element_blank())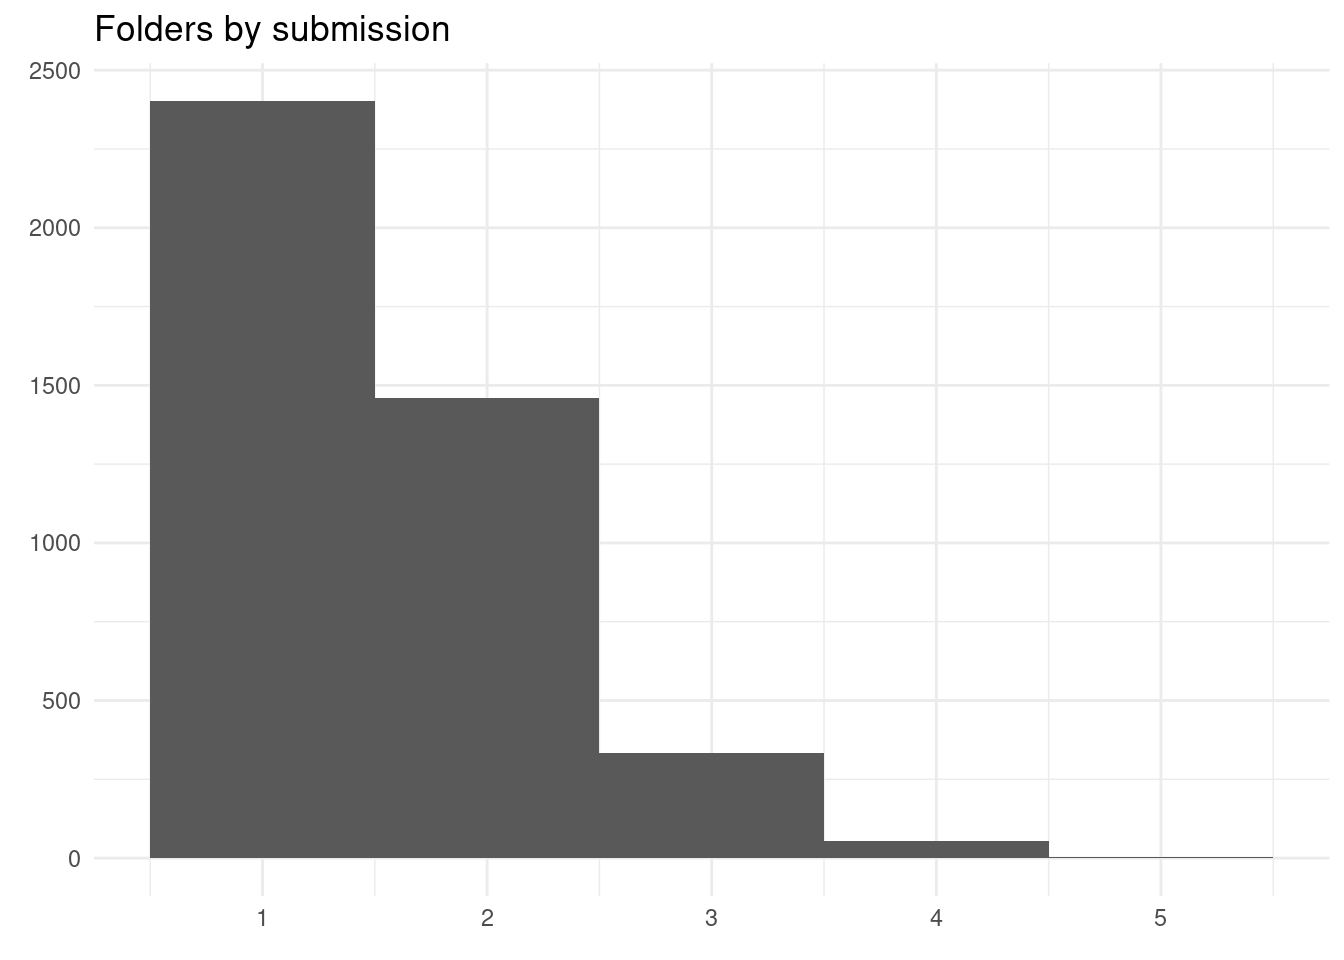
Most submissions end up in one folder, but some go up to 5 folders.
Let’s see the most 5 common folders process of submissions:
compact_folders <- function(x) {
  y <- x != lag(x)
  y[1] <- TRUE
  x[y]
}
cran_times %>%
  group_by(package, submission_n) %>%
  summarize (folder = list(compact_folders(folder))) %>%
  ungroup() %>%
  count(folder, sort = TRUE) %>%
  top_n(5) %>%
  rename(Folders = folder, Frequency = n) %>%
  as.data.frame()
##            Folders Frequency
## 1          pretest      1433
## 2 pretest, inspect       422
## 3          inspect       301
## 4 pretest, newbies       279
## 5          newbies       245
As expected the pretest and newbies are one of the most frequent folders.
Another way of seeing whether it is a right moment to submit your package, aside of how many packages are on the queue, is looking how much activity there is:
subm3 <- cran_times %>%
  arrange(snapshot_time) %>%
  group_by(package) %>%
  mutate(autor_change = submission_n != lag(submission_n),
         cran_change = folder != lag(folder)) %>%
  mutate(autor_change = ifelse(is.na(autor_change), TRUE, autor_change),
         cran_change = ifelse(is.na(cran_change), FALSE, cran_change)) %>%
  mutate(cran_change = case_when(subfolder != lag(subfolder) ~ TRUE,
                                 TRUE ~ cran_change)) %>%
  ungroup()
subm3 %>%
  group_by(snapshot_time) %>%
  summarize(autor_change = sum(autor_change), cran_change = sum(cran_change)) %>%
  filter(row_number() != 1) %>%
  filter(autor_change != 0 | cran_change != 0) %>%
  ggplot() +
  geom_rect(data = holidays, aes(xmin = start, xmax = end),
            ymin = -26, ymax = 26, alpha = 0.5, fill = "grey") +
  geom_point(aes(snapshot_time, autor_change), fill = "blue", size = 0) +
  geom_area(aes(snapshot_time, autor_change), fill = "blue") +
  geom_point(aes(snapshot_time, -cran_change), fill = "red", size = 0) +
  geom_area(aes(snapshot_time, -cran_change), fill = "red") +
  scale_x_datetime(date_labels = "%Y/%m/%d", date_breaks = "2 weeks",
                   expand = expansion(add = 2)) +
  scale_y_continuous(expand = expansion(add = c(0, 0))) +
  coord_cartesian(ylim = c(-26, 26)) +
  annotate("text", label = "CRAN's", y = 20, x = as_datetime("2020/11/02")) +
  annotate("text", label = "Maintainers'", y = -20, x = as_datetime("2020/11/02")) +
  labs(y = "Changes", x = element_blank(), title = "Activity on CRAN:")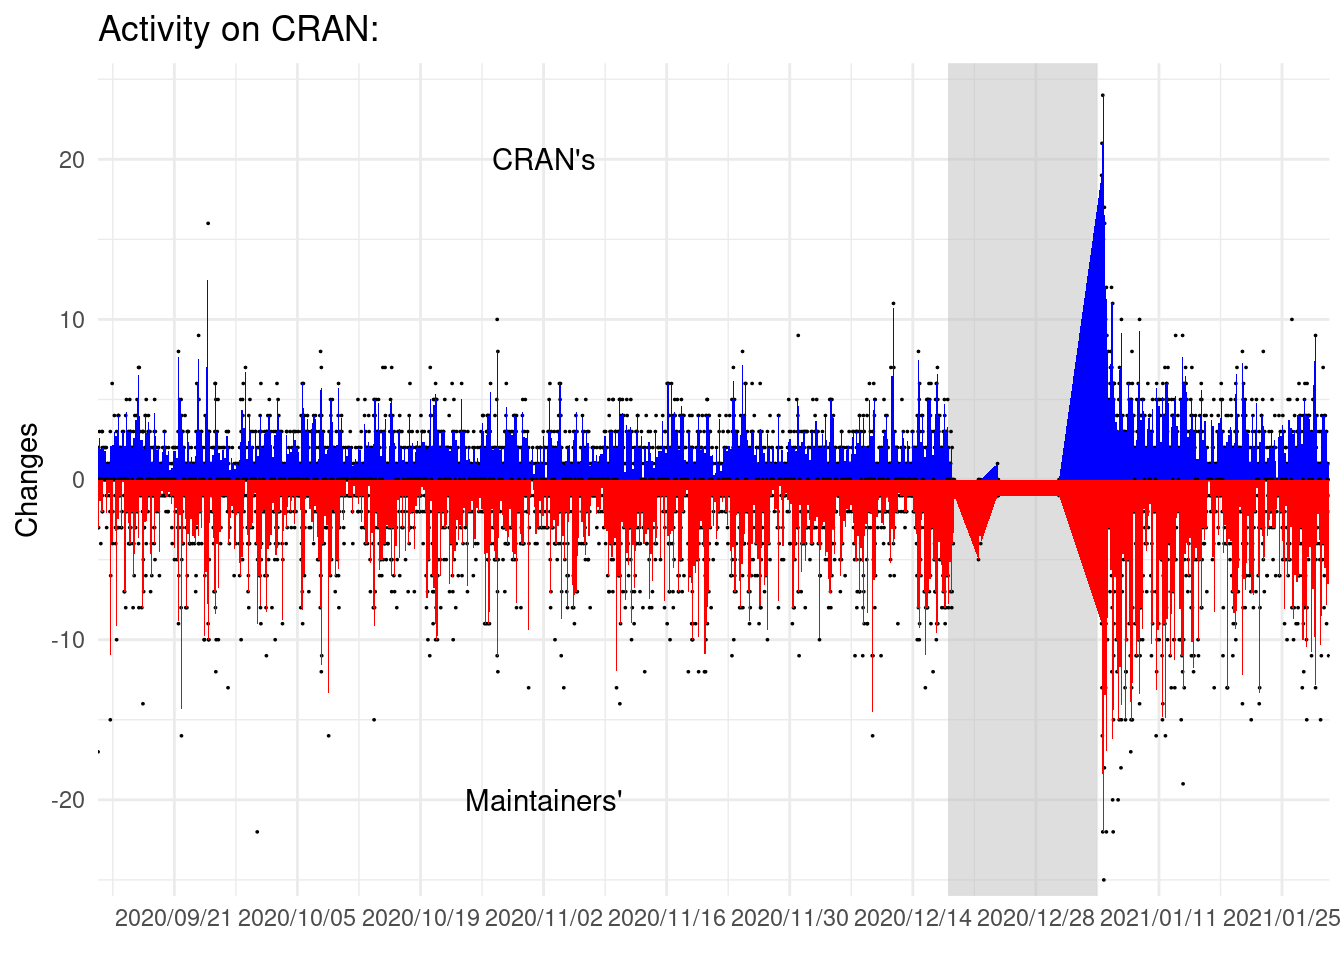
On this plot we can see that changes on folders or submissions are not simultaneous. But they are quite frequent.
Review process
There is a scheme about how does the review process work. However, it has been pointed out that it needs an update.
We’ve seen which folders go before which ones, but we haven’t looked up what is the last folder in which package appear:
cran_times %>%
  ungroup() %>%
  group_by(package, submission_n) %>%
  arrange(snapshot_time) %>%
  filter(1:n() == last(n())) %>%
  ungroup() %>%
  count(folder, sort = TRUE) %>%
knitr::kable(col.names = c("Last folder", "Submissions"))| Last folder | Submissions |
|---|---|
| pretest | 1653 |
| newbies | 981 |
| inspect | 890 |
| recheck | 555 |
| publish | 469 |
| waiting | 441 |
| human | 332 |
| pending | 225 |
We can see that many submissions were left at the pretest, and just a minority on the human or publish folders.
Time it takes to disappear from the system
One of the motivations to do this post was a question on R-pkg-devel, about how long does it usually take for a package to be accepted on CRAN. We can look how long does each submission take until it is removed from the queue:
package_submissions <- cran_times %>%
  group_by(package, submission_n) %>%
  summarise(submission_period = difftime(max(snapshot_time),
                                         min(snapshot_time),
                                         units = "hour"),
            submission_time = min(snapshot_time)) %>%
  ungroup() %>%
  filter(submission_period != 0)
This is a good approximation about how long does it take a package to be accepted or rejected, but some packages remain on the queue after they are accepted and appear on CRAN. Joining this data with data from metacran we could know how often does this happend. But I leave that for the reader or some other posts. Let’s go back to time spend on the queue:
package_submissions %>%
  # filter(submission_time < holidays$start) %>%
  ggplot() +
  geom_point(aes(submission_time, submission_period, col = submission_n)) +
  geom_rect(data = holidays, aes(xmin = start, xmax = end),
            ymin = 0, ymax = 3500, alpha = 0.5, fill = "red") +
  scale_x_datetime(date_labels = "%Y/%m/%d", date_breaks = "2 weeks",
                   expand = expansion(add = 10)) +
  scale_y_continuous(expand = expansion(add = 10)) +
  labs(title = "Time on the queue according to the submission",
       x = "Submission", y = "Time (hours)", col = "Submission") +
  theme(legend.position = c(0.5, 0.8))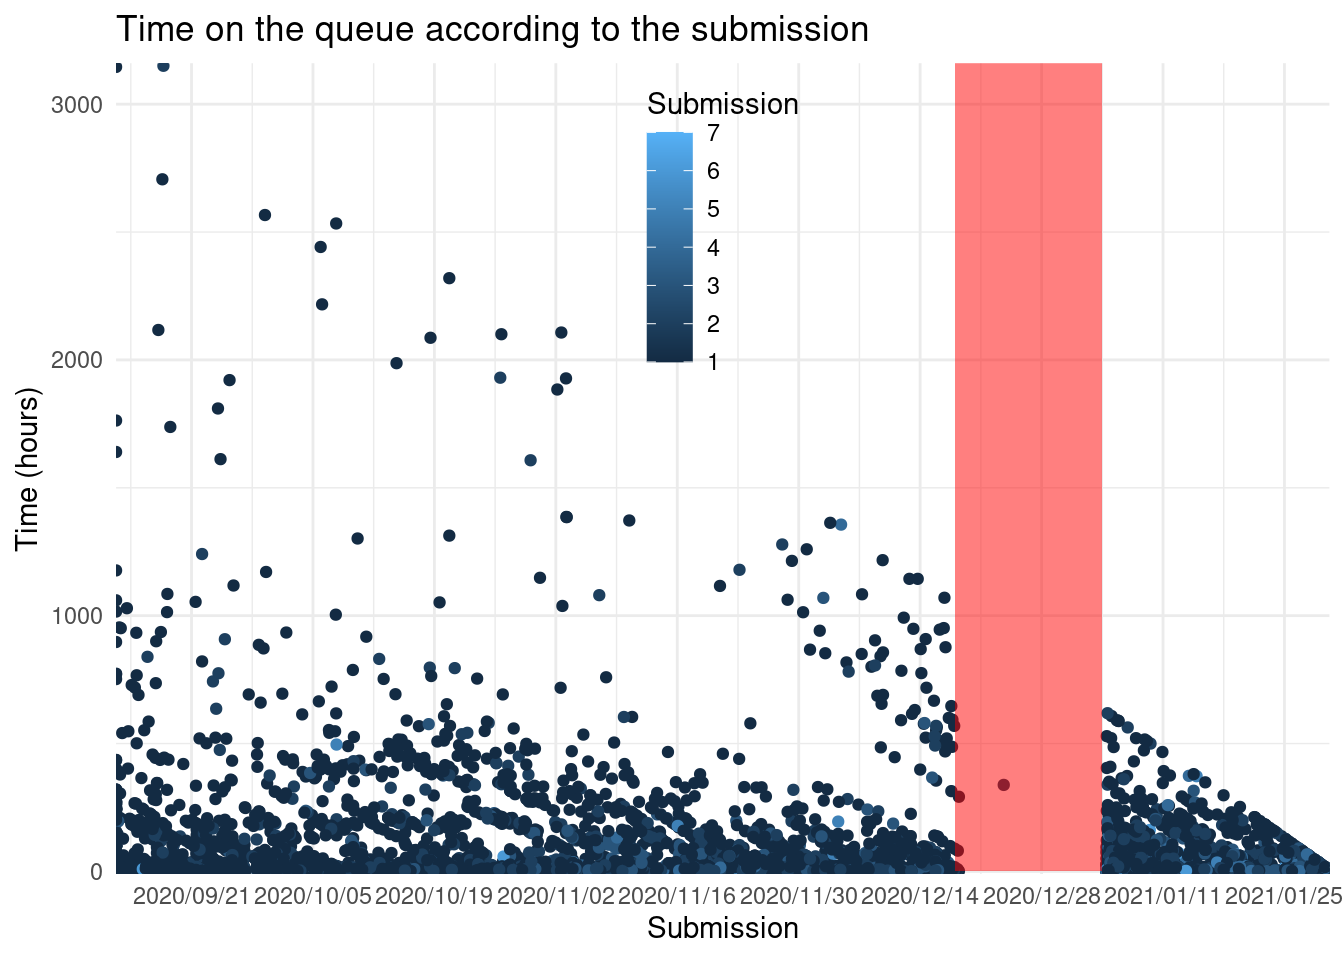
These diagonals suggest that the work is done in batches in a day or an afternoon. And the prominent diagonal after holidays are packages still on the queue.
If we summarize by day and take the median of all the first package submission we can see how much long is a package on the queue:
package_submissions %>%
  filter(submission_n == 1) %>%
  ungroup() %>%
  mutate(d = as.Date(submission_time)) %>%
  group_by(d) %>%
  summarize(m = median(submission_period)) %>%
  ggplot() +
  geom_rect(data = holidays, aes(xmin = as.Date(start), xmax = as.Date(end)),
            ymin = 0, ymax = 80, alpha = 0.5, fill = "red") +
  geom_smooth(aes(d, m)) +
  coord_cartesian(ylim = c(0, NA)) +
  scale_x_date(date_labels = "%Y/%m/%d", date_breaks = "2 weeks",
                   expand = expansion(add = 1)) +
  labs(x = element_blank(), y = "Daily median time in queue (hours)",
       title = "Submission time")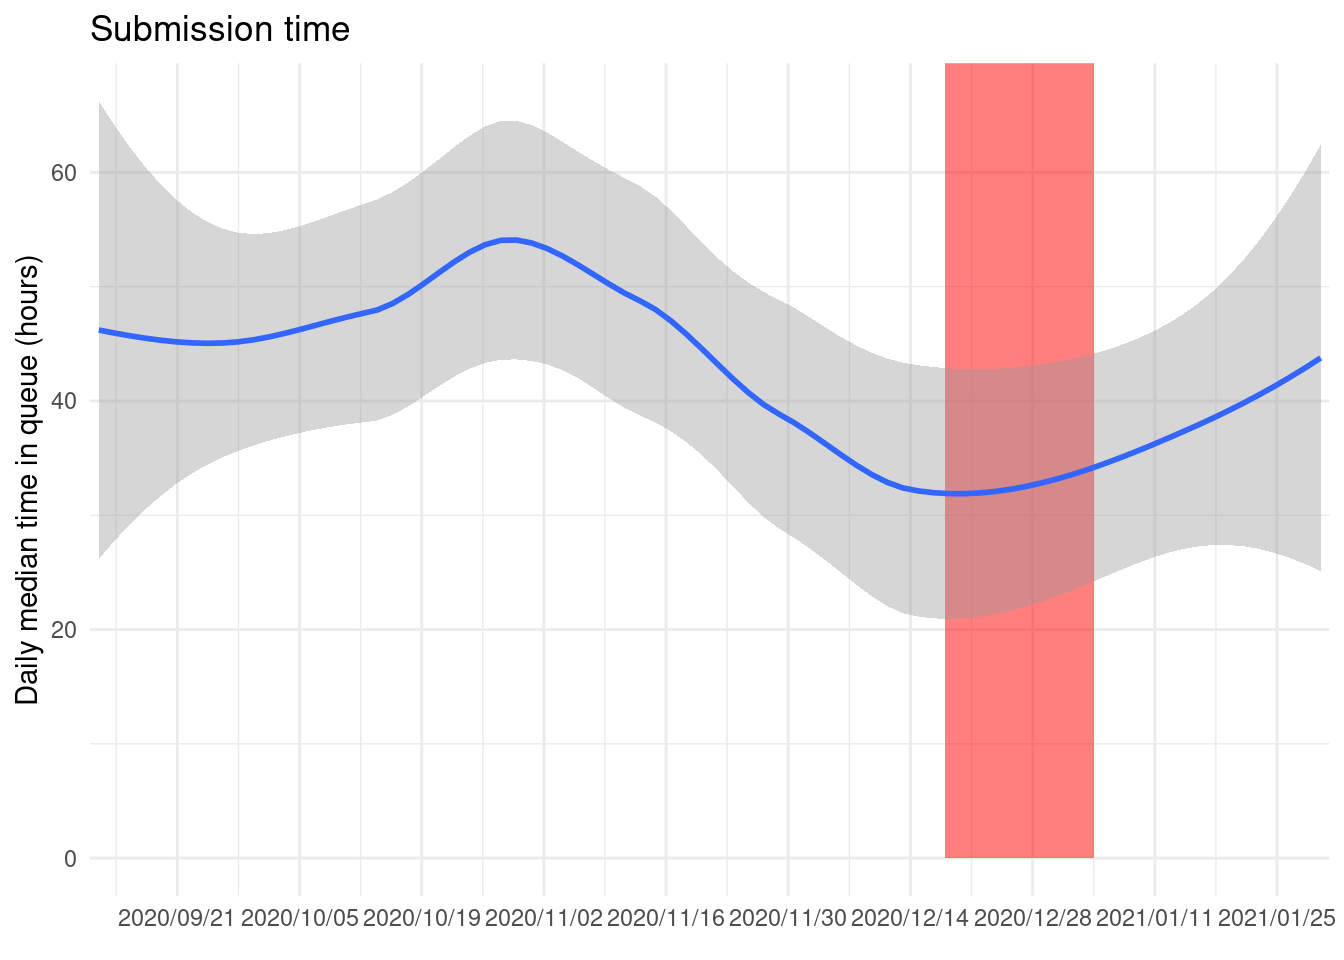
We can see that usually it takes more than a day to disappear from the queue for a new package submitted on CRAN.
There is a lot of variation among submissions:
package_submissions %>%
  group_by(submission_n) %>%
  mutate(submission_n = as.character(submission_n)) %>%
  ggplot() +
  geom_jitter(aes(submission_n, submission_period), height = 0) +
  scale_y_continuous(limits = c(1, NA), expand = expansion(add = c(1, 10)),
                     breaks = seq(0,  4550, by = 24*7)) +
  labs(title = "Submission time in queue", y = "Hours", x = element_blank())
## Warning: Removed 142 rows containing missing values (geom_point).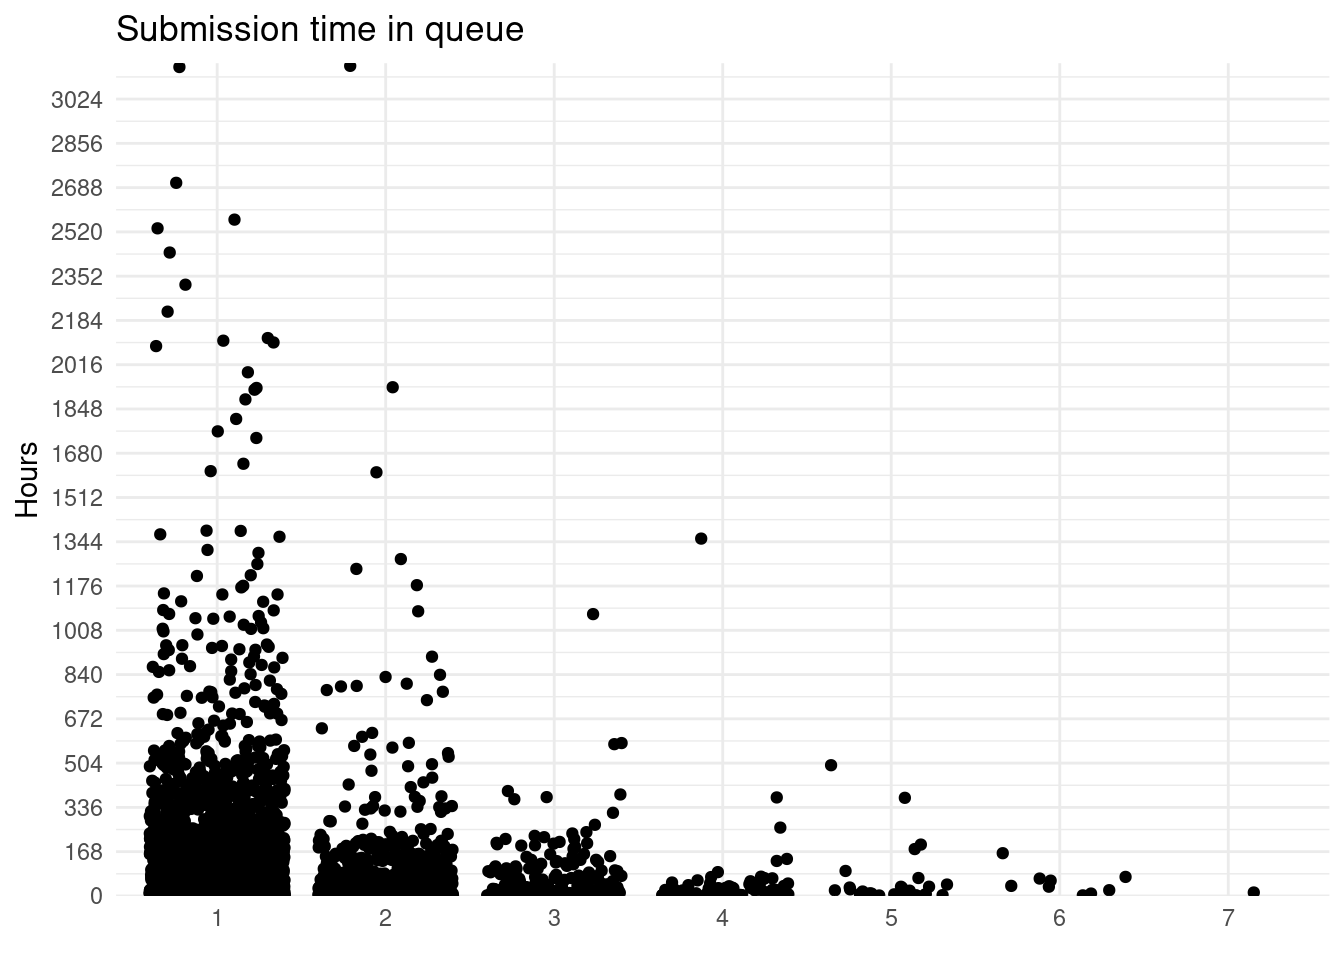
Surprisingly sometimes a submissions goes missing from the folders for some days (I checked with one package I submitted and it doesn’t appear for 7 days, although it was on the queue). This might affect this analysis as it will count them as new submissions but some of them won’t be.
package_submissions %>%
  filter(submission_period != 0) %>%
  group_by(submission_n) %>%
  mutate(submission_n = as.character(submission_n)) %>%
  filter(n() > 5) %>%
  summarize(median = round(median(submission_period), 2)) %>%
knitr::kable(col.names = c("Submission", "Median time (h)"))| Submission | Median time (h) |
|---|---|
| 1 | 36.13 hours |
| 2 | 18.27 hours |
| 3 | 16.47 hours |
| 4 | 11.27 hours |
| 5 | 13.37 hours |
| 6 | 38.08 hours |
So it usually takes more than a day for new packages and later is around 12 hours.
To set in context the work done by CRAN checking system, which is the one that helps to keep the high quality of the packages, let’s explore other checking system: GitHub actions.
GitHub action reliability
The data of this post was collected using Github actions by cransays. Well use this data to test how reliable GitHub actions are.
gha <- cbind(cran_times[, c("month", "mday", "wday", "week")],
      minute = minute(cran_submissions$snapshot_time),
      hour = hour(cran_times$snapshot_time),
      type = "cransays") %>%
  distinct()
gha %>%
  ggplot() +
  geom_violin(aes(as.factor(hour), minute)) +
  scale_y_continuous(expand = expansion(add = 0.5),
                     breaks = c(0, 15, 30, 45, 60), limits = c(0, 60)) +
  scale_x_discrete(expand = expansion())  +
  labs(x = "Hour", y = "Minute", title = "Daily variation")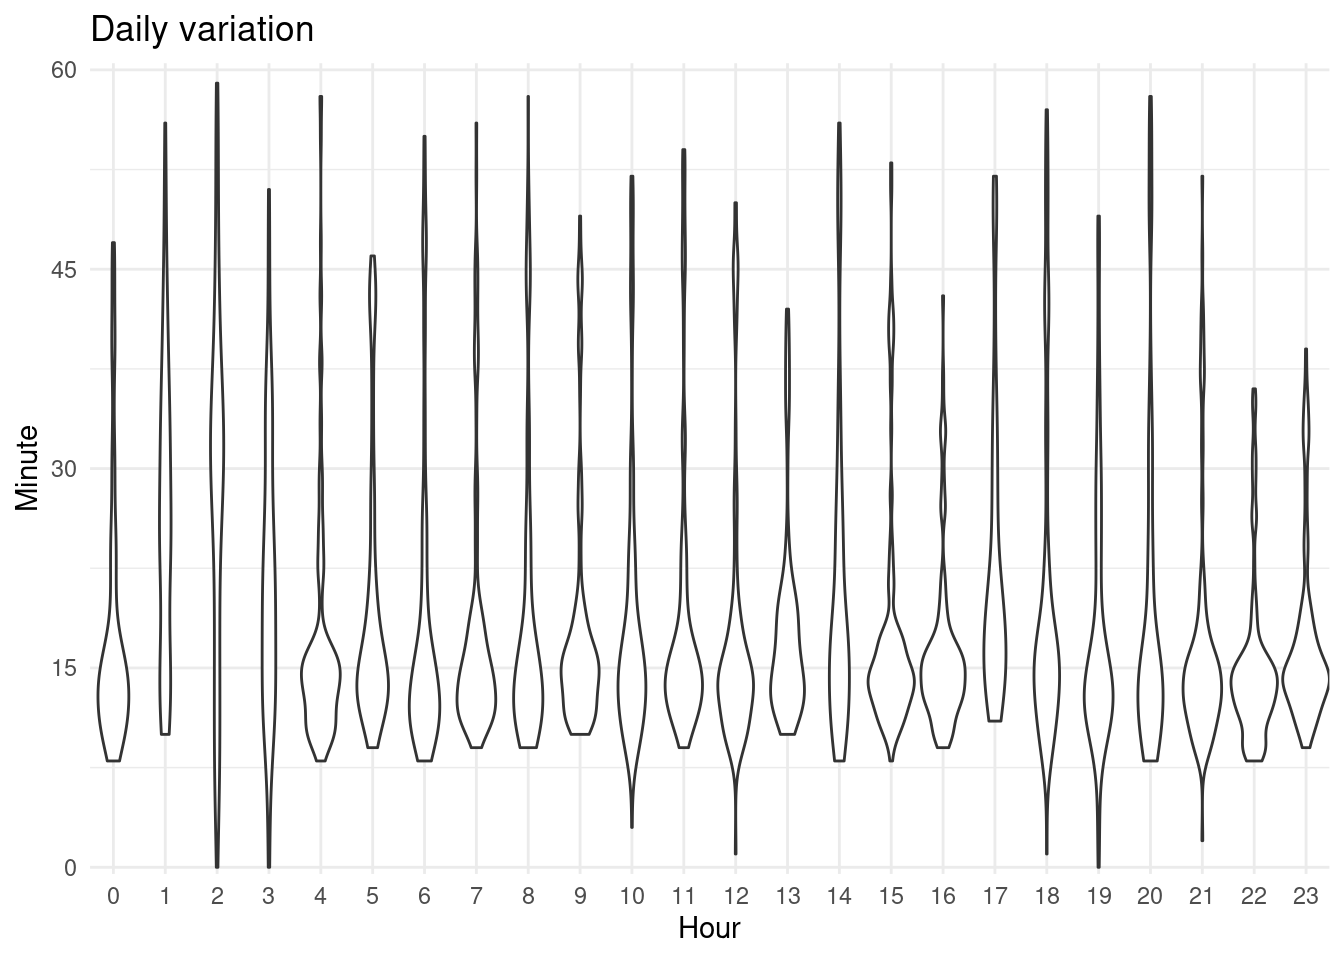
There seems to be a lower limit around 10 minutes except for some builds that I think were manually triggered. Aside from this, there is usually low variation and the process end around ~ 15 minutes but it can end much later. This is just for one simple script scrapping a site. Compared to thousands of packages builds and checks it is much simpler.
And last how reliable it is?
We can compare how many hours are between the first and the last report and how many do we have recorded. If we have less this indicate errors on GHA.
So the script and github actions worked on ~96.9646576% of the times.
These numbers are great, but on CRAN and Bioconductor all packages are checked daily on several OS consistently.
Conclusions
Some of the most important points from this post:
- Some packages appear on several folders and even there are times that multiple versions of a package are on the queue.
- Most submission happens in the first days of the week and towards the beginning of the month.
- Most of the submissions disappear from the CRAN queue in less than a day but new submission take around 36 hours.
- There’s a new package submission to CRAN every hour.
- In later submissions time in the queue is considerably shorter.
- It was impossible to know when there was a reply from CRAN, as no information is provided.
- Not possible to know when a package has all OK before it hits CRAN as some packages remain in the queue even after acceptance.
Last, I compare the review system with other reviews of R software like Bioconductor and rOpenSci.
One big difference between CRAN and Bioconductor or rOpenSci is that even if your package is already included each time you want to fix something it gets reviewed by someone. This ensures a high quality of the packages, as well as increases the work for the reviewers.
Also, the list of reviewers as far as I know is just 5 people who also are part of the developers maintaining and developing R. In Bioconductor it is the same (except they do not to take care of R itself) but in rOpenSci this doesn’t happen that way.
The next big difference is the lack of transparency on the process of the review itself. Perhaps because CRAN started earlier (1997) while Bioconductor in 2002 and rOpenSci much later. On CRAN with the information available we don’t know the steps to be accepted beyond the pretest and the manual review. We don’t know when the package is accepted or rejected, what is the content of the feedback to the maintainer (or when there is feedback and how long does the maintainer get to address those changes). It is no clear how does the process work. Additionally, the reviewer’s work seems highly manual as we found some duplicated packages on the queue.
Further automatization and transparency on the process could help reduce the load on the reviewers, as well as increasing the number of reviewers. A public review could help reduce the burden to CRAN reviewers as outsiders could help solving errors (although this is somewhat already fulfilled by the mailing list R-package-devel), and would help notice and find a compromise on inconsistencies between reviews. As anecdotal evidence I submitted two packages one shortly after the first, on the second package they asked me to change some URLS that on the first I wasn’t required to change.
Another difference between these three repositories are the manuals.
It seems that CRAN repository is equated to be R, so the manual for writing R extensions is under cran.r-project.org, while this is about extending R and can and does happen outside CRAN.
The CRAN policies changes without notice to the existing developers. Sending an email to the maintainers or R-announce mailing list would help developers to notice policy changes. Developers had to create a policy watch and other resources to keep up with CRAN changes that not only affect them on submitting a package but also on packages already included on CRAN.
The CRAN reviewers are involved on multiple demanding tasks: their own regular jobs and outside work (familiar, friend, other interests) commitments, and then, R development and maintenance, CRAN reviews and maintenance, R-journal3. One possible solution to reduce the burden for them is increase the number of reviewers. Perhaps a mentorship program to review packages or a guideline to what to check training and would help reduce the pressure on the current volunteers.
The peace and work of the maintainers as seen on this analysis is huge, and much more that cannot be seen with this data. Many thanks to all the volunteers that maintain it, those who donate to the R Foundation and the employers of those volunteers that make possible CRAN and R.
Reproducibility
## NULL
## ─ Session info ───────────────────────────────────────────────────────────────────────────────────────────────────────
##  setting  value
##  version  R version 4.0.1 (2020-06-06)
##  os       Ubuntu 20.04.3 LTS
##  system   x86_64, linux-gnu
##  ui       X11
##  language (EN)
##  collate  en_US.UTF-8
##  ctype    en_US.UTF-8
##  tz       Europe/Madrid
##  date     2021-08-25
##
## ─ Packages ───────────────────────────────────────────────────────────────────────────────────────────────────────────
##  package      * version     date       lib source
##  assertthat     0.2.1       2019-03-21 [1] CRAN (R 4.0.1)
##  backports      1.2.1       2020-12-09 [1] CRAN (R 4.0.1)
##  blogdown       1.3         2021-04-14 [1] CRAN (R 4.0.1)
##  bookdown       0.22        2021-04-22 [1] CRAN (R 4.0.1)
##  broom          0.7.6       2021-04-05 [1] CRAN (R 4.0.1)
##  bslib          0.2.5       2021-05-12 [1] CRAN (R 4.0.1)
##  cellranger     1.1.0       2016-07-27 [1] CRAN (R 4.0.1)
##  cli            2.5.0       2021-04-26 [1] CRAN (R 4.0.1)
##  colorspace     2.0-1       2021-05-04 [1] CRAN (R 4.0.1)
##  crayon         1.4.1       2021-02-08 [1] CRAN (R 4.0.1)
##  DBI            1.1.1       2021-01-15 [1] CRAN (R 4.0.1)
##  dbplyr         2.1.1       2021-04-06 [1] CRAN (R 4.0.1)
##  digest         0.6.27      2020-10-24 [1] CRAN (R 4.0.1)
##  dplyr        * 1.0.6       2021-05-05 [1] CRAN (R 4.0.1)
##  ellipsis       0.3.2       2021-04-29 [1] CRAN (R 4.0.1)
##  evaluate       0.14        2019-05-28 [1] CRAN (R 4.0.1)
##  fansi          0.5.0       2021-05-25 [1] CRAN (R 4.0.1)
##  farver         2.1.0       2021-02-28 [1] CRAN (R 4.0.1)
##  forcats      * 0.5.1       2021-01-27 [1] CRAN (R 4.0.1)
##  fs             1.5.0       2020-07-31 [1] CRAN (R 4.0.1)
##  generics       0.1.0       2020-10-31 [1] CRAN (R 4.0.1)
##  ggplot2      * 3.3.5       2021-06-25 [1] CRAN (R 4.0.1)
##  glue           1.4.2       2020-08-27 [1] CRAN (R 4.0.1)
##  gtable         0.3.0       2019-03-25 [1] CRAN (R 4.0.1)
##  haven          2.4.1       2021-04-23 [1] CRAN (R 4.0.1)
##  here           1.0.1       2020-12-13 [1] CRAN (R 4.0.1)
##  highr          0.9         2021-04-16 [1] CRAN (R 4.0.1)
##  hms          * 1.0.0       2021-01-13 [1] CRAN (R 4.0.1)
##  htmltools      0.5.1.1     2021-01-22 [1] CRAN (R 4.0.1)
##  httr           1.4.2       2020-07-20 [1] CRAN (R 4.0.1)
##  jquerylib      0.1.4       2021-04-26 [1] CRAN (R 4.0.1)
##  jsonlite       1.7.2       2020-12-09 [1] CRAN (R 4.0.1)
##  knitr          1.33        2021-04-24 [1] CRAN (R 4.0.1)
##  labeling       0.4.2       2020-10-20 [1] CRAN (R 4.0.1)
##  lattice        0.20-41     2020-04-02 [1] CRAN (R 4.0.1)
##  lifecycle      1.0.0       2021-02-15 [1] CRAN (R 4.0.1)
##  lubridate    * 1.7.10.9000 2021-06-12 [1] Github (tidyverse/lubridate@1e0d66f)
##  magrittr       2.0.1       2020-11-17 [1] CRAN (R 4.0.1)
##  Matrix         1.3-2       2021-01-06 [1] CRAN (R 4.0.1)
##  mgcv           1.8-35      2021-04-18 [1] CRAN (R 4.0.1)
##  modelr         0.1.8       2020-05-19 [1] CRAN (R 4.0.1)
##  munsell        0.5.0       2018-06-12 [1] CRAN (R 4.0.1)
##  nlme           3.1-152     2021-02-04 [1] CRAN (R 4.0.1)
##  patchwork    * 1.1.1       2020-12-17 [1] CRAN (R 4.0.1)
##  pillar         1.6.1       2021-05-16 [1] CRAN (R 4.0.1)
##  pkgconfig      2.0.3       2019-09-22 [1] CRAN (R 4.0.1)
##  purrr        * 0.3.4       2020-04-17 [1] CRAN (R 4.0.1)
##  R6             2.5.0       2020-10-28 [1] CRAN (R 4.0.1)
##  RColorBrewer   1.1-2       2014-12-07 [1] CRAN (R 4.0.1)
##  Rcpp           1.0.6       2021-01-15 [1] CRAN (R 4.0.1)
##  readr        * 1.4.0       2020-10-05 [1] CRAN (R 4.0.1)
##  readxl         1.3.1       2019-03-13 [1] CRAN (R 4.0.1)
##  reprex         2.0.0       2021-04-02 [1] CRAN (R 4.0.1)
##  rlang          0.4.11      2021-04-30 [1] CRAN (R 4.0.1)
##  rmarkdown      2.9         2021-06-15 [1] CRAN (R 4.0.1)
##  rprojroot      2.0.2       2020-11-15 [1] CRAN (R 4.0.1)
##  rstudioapi     0.13        2020-11-12 [1] CRAN (R 4.0.1)
##  rvest          1.0.0       2021-03-09 [1] CRAN (R 4.0.1)
##  sass           0.4.0       2021-05-12 [1] CRAN (R 4.0.1)
##  scales         1.1.1       2020-05-11 [1] CRAN (R 4.0.1)
##  sessioninfo    1.1.1       2018-11-05 [1] CRAN (R 4.0.1)
##  stringi        1.6.2       2021-05-17 [1] CRAN (R 4.0.1)
##  stringr      * 1.4.0       2019-02-10 [1] CRAN (R 4.0.1)
##  tibble       * 3.1.2       2021-05-16 [1] CRAN (R 4.0.1)
##  tidyr        * 1.1.3       2021-03-03 [1] CRAN (R 4.0.1)
##  tidyselect     1.1.1       2021-04-30 [1] CRAN (R 4.0.1)
##  tidyverse    * 1.3.1       2021-04-15 [1] CRAN (R 4.0.1)
##  utf8           1.2.1       2021-03-12 [1] CRAN (R 4.0.1)
##  vctrs          0.3.8       2021-04-29 [1] CRAN (R 4.0.1)
##  viridisLite    0.4.0       2021-04-13 [1] CRAN (R 4.0.1)
##  withr          2.4.2       2021-04-18 [1] CRAN (R 4.0.1)
##  xfun           0.24        2021-06-15 [1] CRAN (R 4.0.1)
##  xml2           1.3.2       2020-04-23 [1] CRAN (R 4.0.1)
##  yaml           2.2.1       2020-02-01 [1] CRAN (R 4.0.1)
##
## [1] /home/lluis/bin/R/4.0.1/lib/R/library