Forest fires in Mexico
Evolucion de los incendios forestales en México
I saw a map on twitter and I wanted to see if I could change a bit and improve it:
I wanted to make so that the fires change the size with time to appear and disappear instead of moving around Mexico.
I got the code from Andrian, I ran the code and stored it:
library("here")
## here() starts at /home/lluis/Documents/Projects/blogR
library("ggplot2")
library("gganimate")
library("ggthemes")
# Maps from mexico
# devtools::install_github('diegovalle/mxmaps')
library("mxmaps")
plottable <- readRDS(here("static", "fires-mexico", "fires_mexico.RDS"))
head(plottable)
##   Grados_Lon Minutos_Lon Segundos_Lon Grados_Lat Minutos_Lat Segundos_Lat
## 1        102           8         36.7         21          58         30.0
## 2        102          12         42.9         22          51         27.4
## 3        102          38         32.1         22           1         46.5
## 4        102          33         53.9         21          55         29.8
## 5        102          13          7.7         22           5         55.6
## 6        102          35         21.8         22          16         24.7
##              Tamaño  Año  Latitud  Longitud
## 1 11 a 20 Hectáreas 2010 21.97500 -102.8565
## 2 11 a 20 Hectáreas 2010 22.85761 -102.7881
## 3   0 a 5 Hectáreas 2010 22.02958 -102.3577
## 4   0 a 5 Hectáreas 2010 21.92494 -102.4350
## 5   0 a 5 Hectáreas 2010 22.09878 -102.7812
## 6   0 a 5 Hectáreas 2010 22.27353 -102.4106
Plot
My main objective was to remove the points moving above the country from year to year. The problem is that the aesthetic was grouped ad the very definition by group.
data(mxstate.map)

m <- ggplot() +
  geom_polygon(data = mxstate.map, aes(x = long, y = lat, group = group),
               fill = "grey", color = "black") +
  geom_point(data = plottable,
             aes(x = Longitud, y = Latitud, group = Año), alpha = .2, color = "red") +
  theme(plot.subtitle = element_text(size = 32, color = "grey")) +
  scale_size_discrete()  +
  theme_map()  +
  coord_map()
## Warning: Using size for a discrete variable is not advised.
m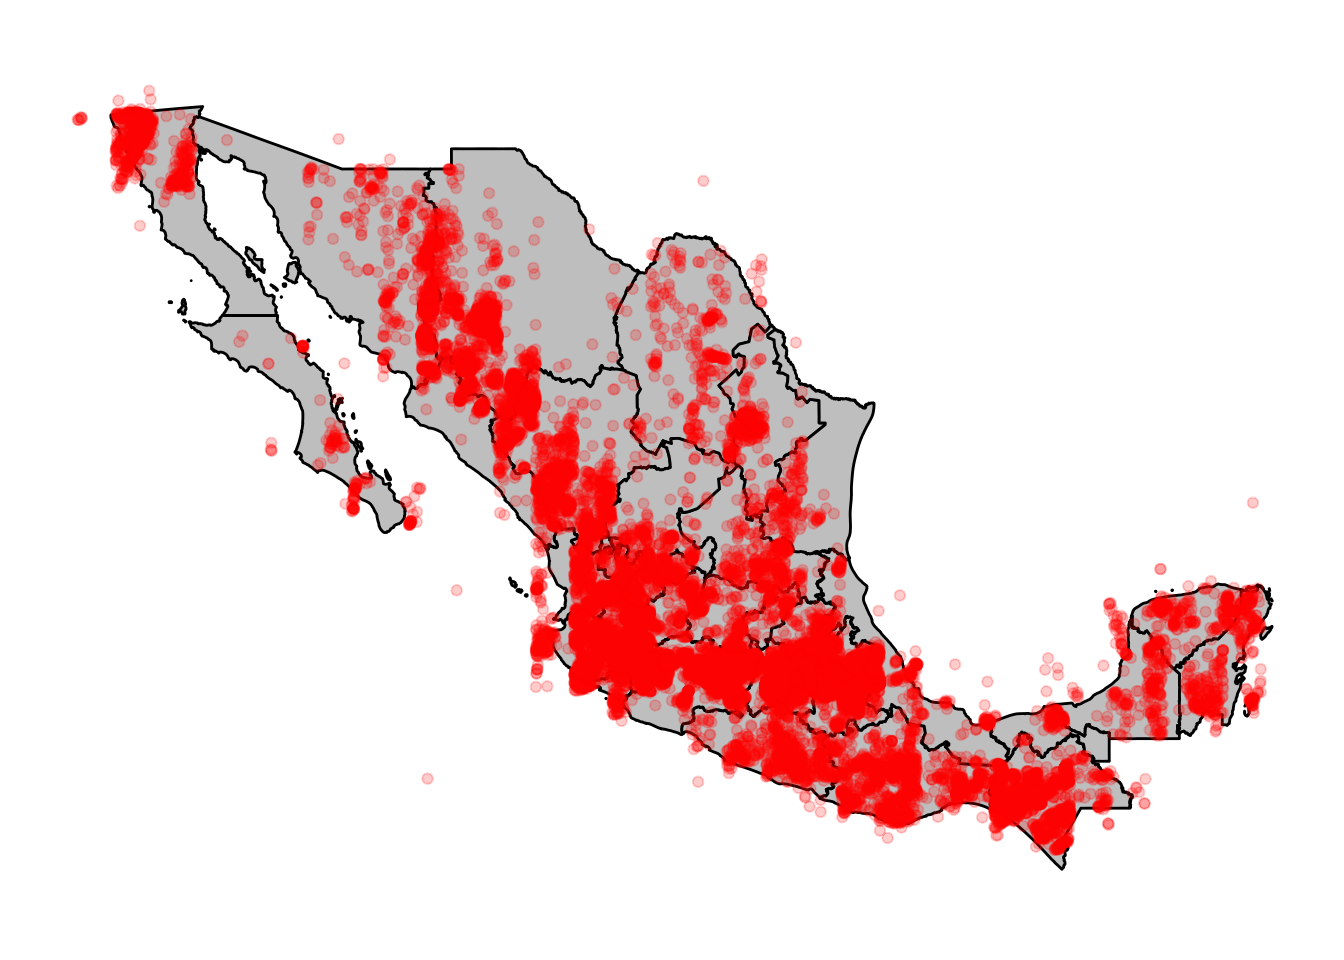
Animation
Now that we have the plot and the fires we can animate it by each year:
gganimation <- m +
  transition_states(Año, transition_length = 11, state_length = 1, wrap = FALSE) +
    enter_fade() +
    exit_fade() +
    labs(title = "Incendios forestales registrados en México",
         subtitle = "Año {closest_state}",
         x = element_blank(),
         y = element_blank(),
         caption = "Source: CONAFOR / Elaboracion: @4drian.bautista & @Lluís_Rev")

animate(gganimation, fps = 25, duration = 10)