Life of a package
Recently the CRAN team lead by Kurt Hornik has made available some more information about the process of CRAN. The information is gathered now at posteriority via analyzing emails they have archived.
Previously I was given access to some data (what I call actions) but there is more that was made public. This fell right within the project I had embarked to create a package to retrieve and ease access to this data. I created the repo.data package in order to analyze it and help developers to use it and repositories to generate this (that later idea is just that at the moment).
Another recently released dataset are the issues: some notifications that CRAN QA team have sent to package maintainers through some years.
With these new datasets now we can know more about how packages fare on CRAN. I am going to analyze it here and present it at useR!2026.
This is a blogpost I make in advance to share and analyze what I’ll present there. Let me know of any feedback and questions that might be possible to answer (or not) that you might have about them.
library("repo.data")
##
## Attaching package: 'repo.data'
## The following object is masked from 'package:stats':
##
##     alias
ca <- cran_archive()
## Warning: There are 5 packages both archived and published
## This indicate manual CRAN intervention.
How often are packages archived?
One first answer is to compare the archive of CRAN with the list of packages available (0). This provides an approximate answer (177678) but misses the most interesting cases in my opinion: packages that were archived and went back to CRAN. With the new actions file we can check what the “internal” records of CRAN say about this.
library("dplyr")
##
## Attaching package: 'dplyr'
## The following objects are masked from 'package:stats':
##
##     filter, lag
## The following objects are masked from 'package:base':
##
##     intersect, setdiff, setequal, union
library("ggplot2")
library("ggrepel")
caa <- cran_actions()
## Warning: There are 35 packages starting with an archive action!
## Warning: There are 271 packages with duplicated actions for the same version.
## Explanation: These indicate a manual intervention of the CRAN team.
pkg_actions <- caa |>
  summarise(.by = c(Date, Action), n = n()) |>
  arrange(Date)
#
# pkg_actions |>
#   summarise(.by = Date, n2 = sum(n[Action == "publish"]) - sum(n[Action != "publish"])) |>
#   mutate(n3 = cumsum(n2)) |>
#   View()
#   ggplot() +
#   geom_smooth(aes(Date, n3)) +
#   theme_minimal() +
#   scale_x_date(date_breaks = "2 years", date_labels = "%y", name = "Year") +
#   scale_y_continuous(limits = c(0, NA), expand = expansion_0NA, name = "Packages on CRAN") +
#   labs(title = "CRAN size")
The above figure might be familiar to you if you check the R-journal and read the report by CRAN on it.
expansion_0NA <- expansion(c(0, NA), c(0, NA))
scale_x_years <- scale_x_date(date_breaks = "2 years", date_labels = "%Y")
gradient_archived <- scales::pal_seq_gradient(low = "black", "red")
pkg_actions |>
  ggplot() +
  geom_smooth(aes(Date, n, col = Action, linetype = Action), span = "1 month",
              method = "gam", formula = y ~ s(x, bs = "cs"), method.args = list(family = "poisson")) +
  theme_minimal() +
  scale_x_years +
  scale_y_continuous(limits = c(0, NA), name = "Actions", expand = c(0, NA),
                     sec.axis = dup_axis(name = NULL)) +
  scale_color_manual(breaks = c("Publish" = "publish", "Archive" = "archive", "Remove" = "remove"),
                     values = c("publish" = "green", "archive" = "orange", "remove" = "red")) +
  scale_linetype(breaks = c("Publish" = "publish", "Archive" = "archive", "Remove" = "remove")) +
  labs(title = "CRAN & maintainers: building a registry",
       subtitle = "Daily actions on CRAN",
       x = NULL) +
  theme(legend.position = "inside",
        legend.position.inside = c(0.2, 0.8),
        legend.box.background = element_rect(colour = "black"),
        plot.title.position = "plot")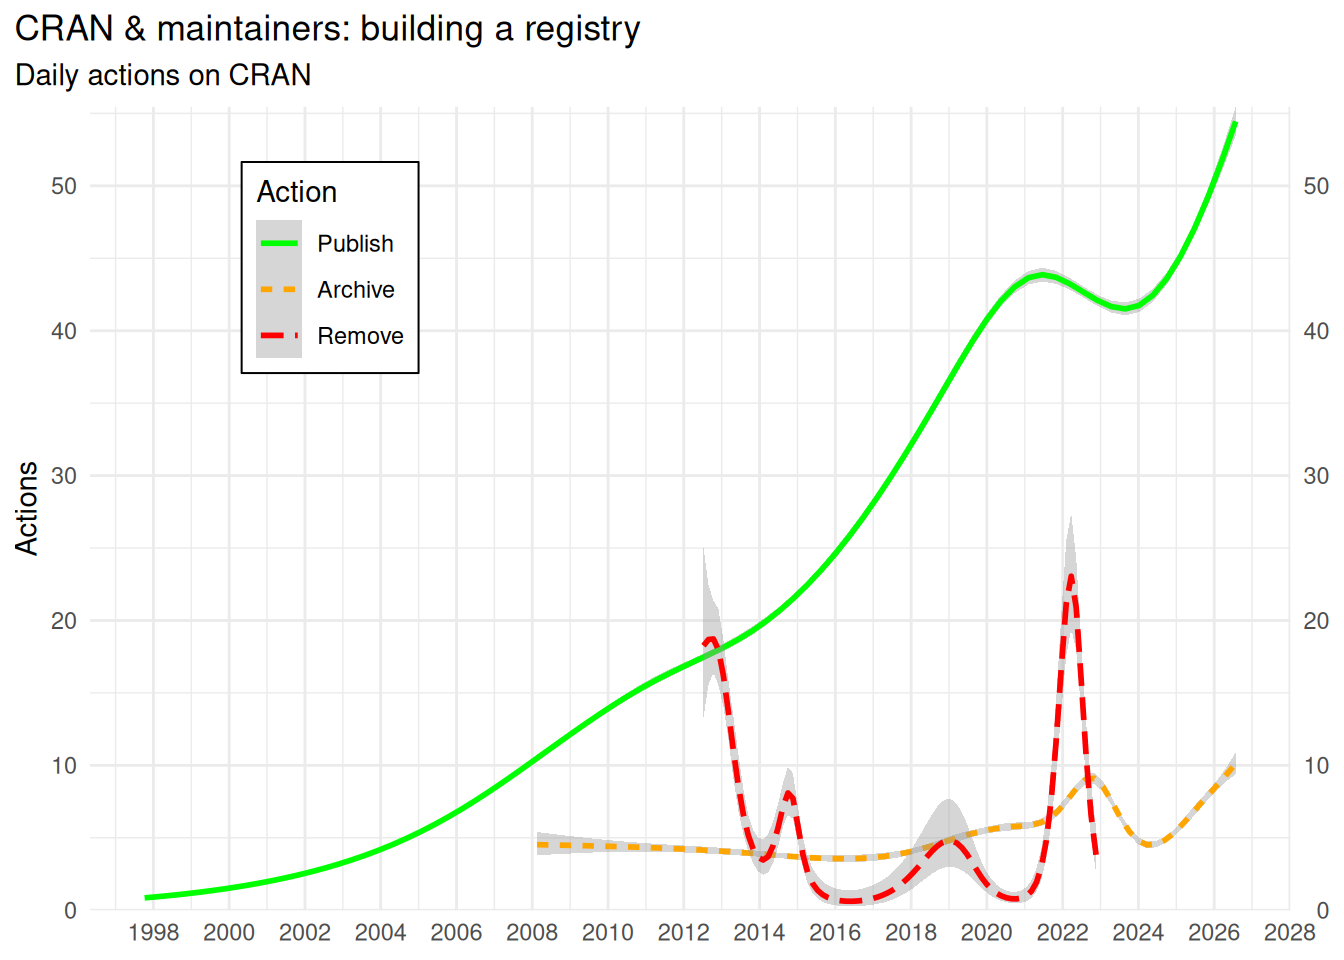
Let’s count the packages on CRAN:
library("tidyr")
library("scales")

first_publication_pkg <- caa |>
  summarise(.by = Package, Date = first(Date))

first_publication <- first_publication_pkg |>
  summarise(.by = Date, first_publish = n()) |>
  arrange(Date)

first_publication |>
  mutate(n2 = cumsum(first_publish)) |>
  ggplot() +
  geom_line(aes(Date, n2)) +
  theme_minimal() +
  scale_x_years +
  scale_y_continuous(limits = c(0, NA), name = "Packages",
                     labels = scales::label_number(                                                   scale_cut = cut_short_scale()),
                     expand = expansion_0NA,
                     sec.axis = dup_axis(name = NULL)) +
  labs(title = "Total packages on CRAN archive",
       subtitle = "Counting archived and removed packages",
       x = NULL) +
  theme(plot.title.position = "plot")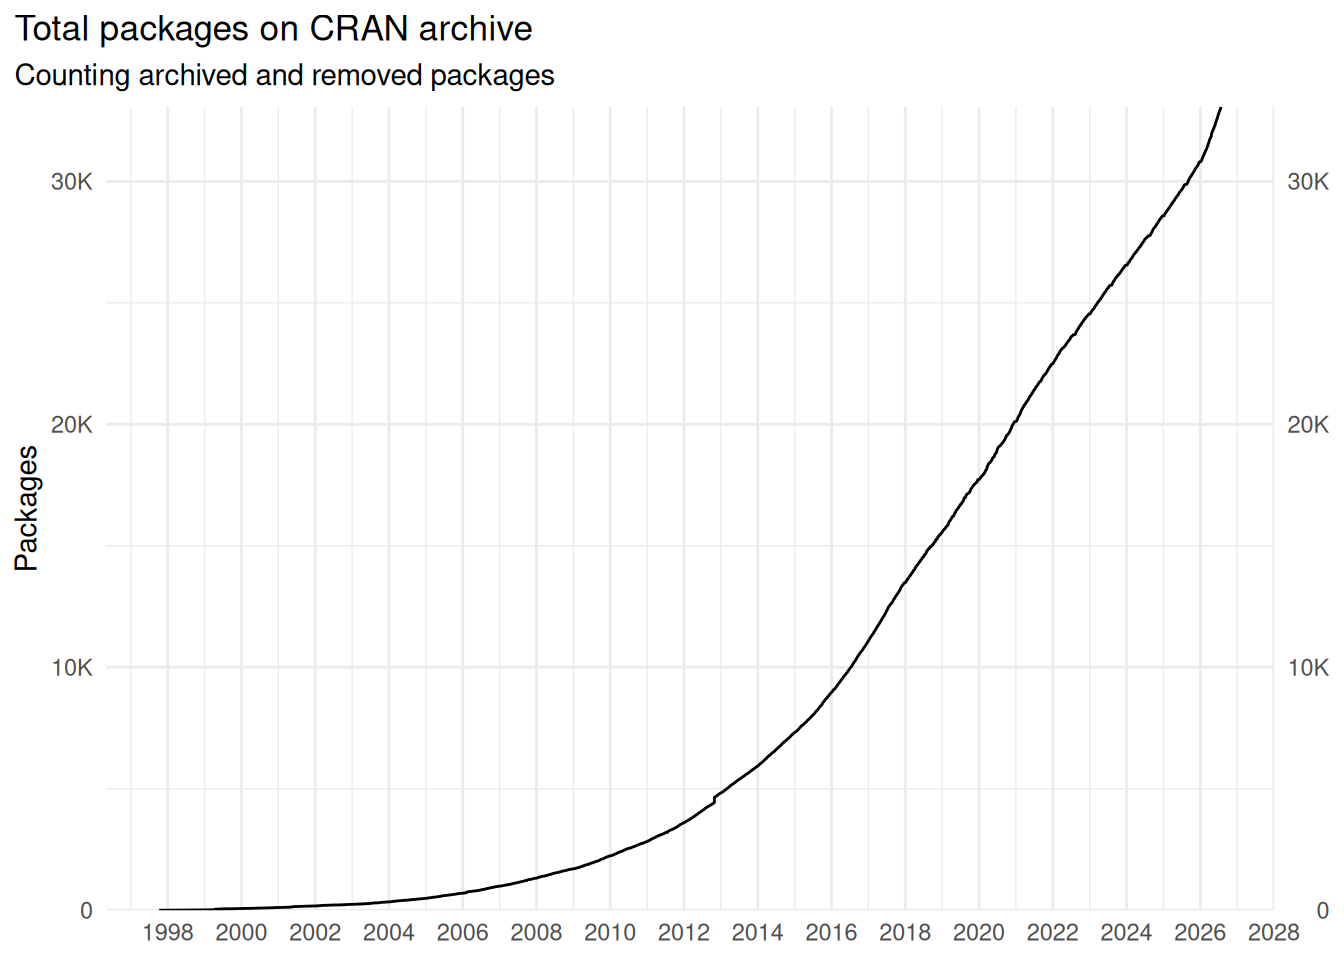
Why is the total number of packages available on CRAN that big? Because packages can be archived
caa2 <- caa |>
  summarise(.by = c(Date, Action), n = n()) |>
  arrange(Date)

caa3 <- caa2 |>
  mutate(.by = Date,
         Publish = sum(n[Action == "publish"]),
         Other = sum(n[Action != "publish"])) |>
  mutate(Publish_cum = cumsum(Publish),
         Other_cum = cumsum(Other))

caa0 <- caa |>
  summarise(.by = Package,
            archived_d = Date[which(Action != "publish")[1]])

cap <- caa |>
  arrange(Date) |>
  mutate(
  .by = Package,
  available = Action == "publish"
  )

pkg_published <- cap |>
  filter(sum(available)>= sum(!available)) |> # 69 archived with no publication
  mutate(.by = Package,
         group0 = cumsum(!available),
         group = lag(cumsum(!available), default = 0L)) |>
  mutate(.by = c(Package, group), k = seq_len(n()) %in% 1) |>
  filter(!available | k)

pp <- pkg_published |>
  summarise(.by = Date,
            published = sum(available),
            not_published = sum(!available)) |>
  mutate(published_sum = cumsum(published),
         not_published_sum = cumsum(not_published),
         total_packages = published_sum - not_published_sum
         )

pp |>
  ggplot() +
  geom_line(aes(Date, not_published_sum/published_sum, linewidth = total_packages), lineend='round') +
  scale_x_years +
  scale_y_continuous(labels = label_percent(),
                     limits = c(0, 1),
                     expand = expansion_0NA,
                     sec.axis = dup_axis(name = NULL)) +
  scale_linewidth(breaks = c(100, 1000, 10000, 20000)) +
  theme_minimal() +
  labs(title = "Rising rate of packages archived",
       subtitle = "Acumulated rate of archived packages",
       x = NULL,
       linewidth = "Packages",
       y = "Rate") +
  theme(plot.title.position = "plot",
        legend.position = "inside",
        legend.position.inside = c(0.2, 0.8),
        legend.box.background = element_rect())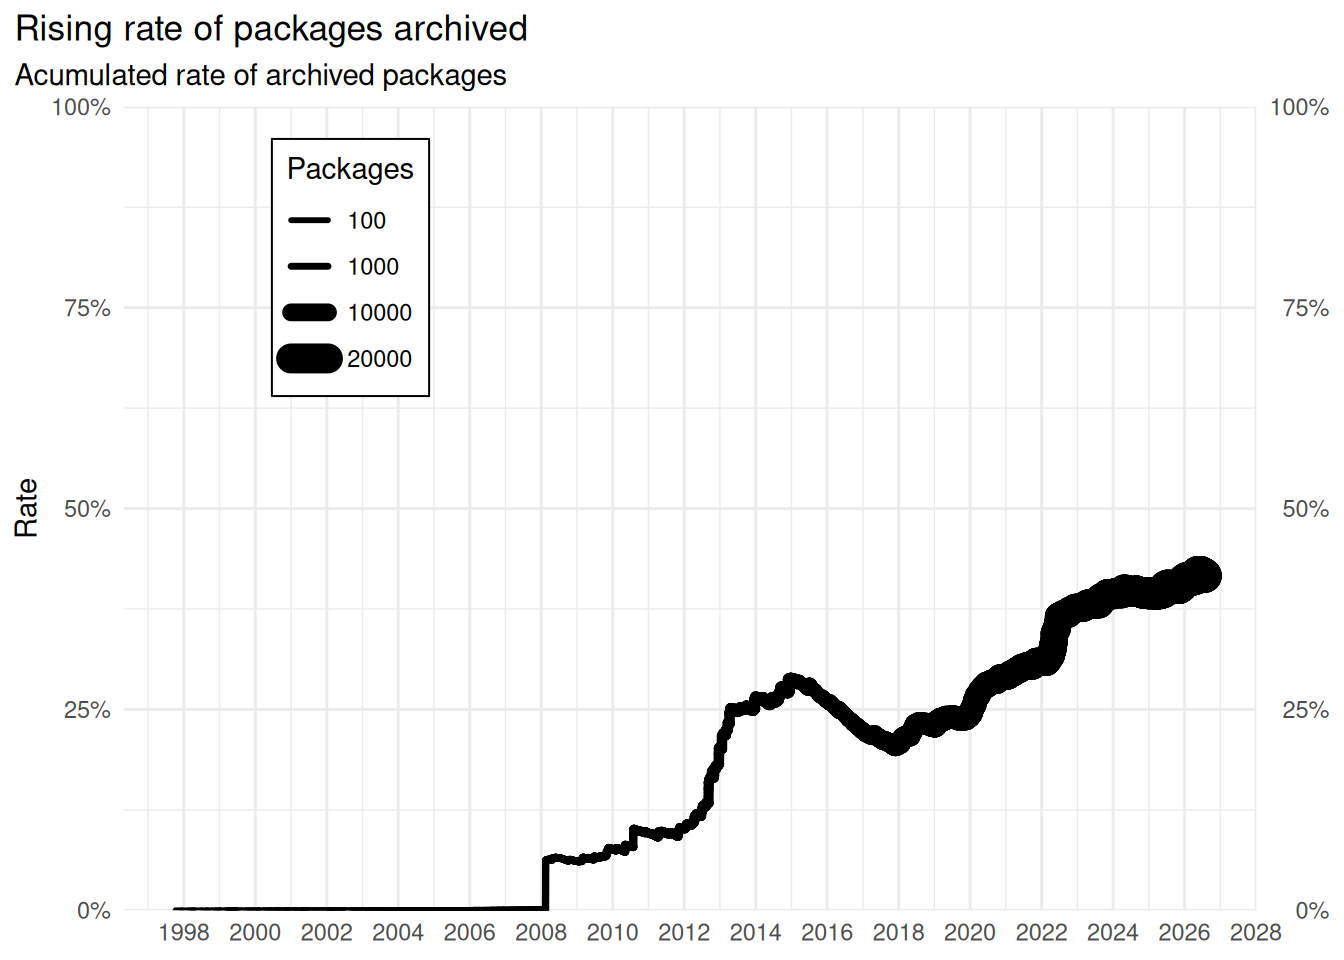
This is not something bad, packages might evolve to a new version or maintainers might move on. But is something to be aware of, most probably your package over 28 years will end up archived.
cap2 <- cap |>
  summarise(.by = Date,
         n_available = n_distinct(Package[available]),
         n_not_available = n_distinct(Package[!available])
  ) |>
  mutate(n_date = n_available - n_not_available,
         n_cum_date = cumsum(n_date))

any_non_publication <- caa |>
  filter(.by = Package, Action != "publish") |>
  summarise(.by = Date, other = n()) |>
  arrange(Date)

any_non_publication2 <- caa |>
  summarise(.by = Package, Date = first(Date[Action != "publish"])) |>
  summarise(.by = Date, other = n()) |>
  arrange(Date)

da <- merge(first_publication, any_non_publication, by = "Date", all = TRUE) |>
  arrange(Date)
da$first_publish[is.na(da$first_publish)] <- 0L
da$other[is.na(da$other)] <- 0L

da <- mutate(da, pkgs = cumsum(first_publish),
         rmv = cumsum(other))

pkg_published |>
  summarise(.by = c(Date, Action),
            n = n()) |>
  mutate(.by = Action,
         n_sum = cumsum(n)) |>
  ggplot() +
  geom_line(aes(Date, n_sum, col = Action, linetype = Action)) +
  theme_minimal() +
  scale_x_years +
  scale_y_continuous(limits = c(0, NA), name = "Packages",
                     expand = expansion_0NA,
                     labels = scales::label_number(                                                   scale_cut = cut_short_scale()),
                     sec.axis = dup_axis(name = NULL)) +
  scale_color_manual(breaks = c("Publish" = "publish", "Archive" = "archive", "Remove" = "remove"),
                     values = c("publish" = "green", "archive" = "orange", "remove" = "red")) +
  scale_linetype(breaks = c("Publish" = "publish", "Archive" = "archive", "Remove" = "remove")) +
  labs(title = "Packages published and those which were archived",
       subtitle = "Published vs archived",
       x = NULL,
       linetype = "Type",
       color = "Type") +
  theme(legend.position = "inside",
        legend.position.inside = c(0.2, 0.8),
        legend.box.background = element_rect(color = "black"),
        plot.title.position = "plot")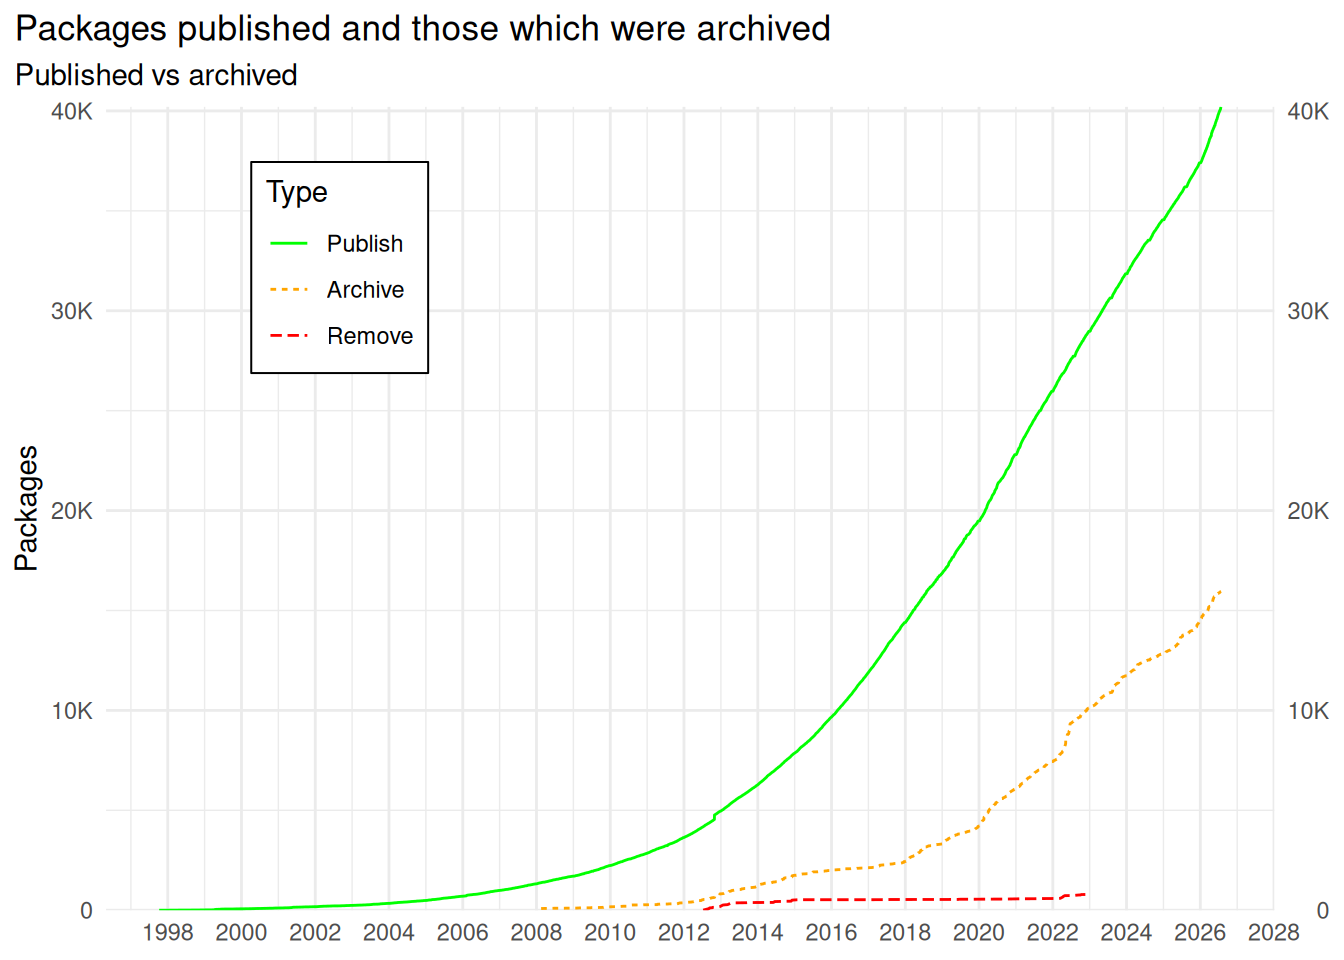
How fast are packages archived?
We’ve seen that less than 40% packages are archived. But knowing when they are archived would provide a new dimension. While this metric doesn’t mean much in isolation I think it is a good metric to know.
It might be bad if a package is archived 2 hours after being public. This indicates a mismatch between submission and being on CRAN or someone picking something that has slipped through the submission process.
While archiving is often considered bad it is also a sign that things have moved on. I requested archiving rtweet as the platform didn’t provide free access to the API (see post about rtweet). Similarly, people might move on to next version of the package, prioritize other projects and stop maintaining it. While I would like to see more maintenance transfers, I think it is very hard for highly specialized tools.
caa_n <- caa |>
  arrange(Package, Date, Time) |>
    mutate(.by = Package,
         publish_n = cumsum(Action == "publish"),
         archive_n = cumsum(Action != "publish")
         )
caa_n |>
  filter(Action == "publish") |>
  summarise(.by = Package, n = max(publish_n)) |>
  count(n, name = "nn") |>
  ggplot() +
  geom_col(aes(n, nn)) +
  scale_x_continuous(expand = expansion_0NA) +
  scale_y_continuous(expand = expansion_0NA, breaks = 1000*0:10,
                     labels = scales::label_number(scale_cut= cut_short_scale())) +
  theme_minimal() +
  labs(title = "Most packages release very few versions",
       subtitle = "Versions released",
       y = "Packages", x = "Versions released") +
  coord_cartesian(xlim = c(NA, 25)) +
  theme(plot.title.position = "plot")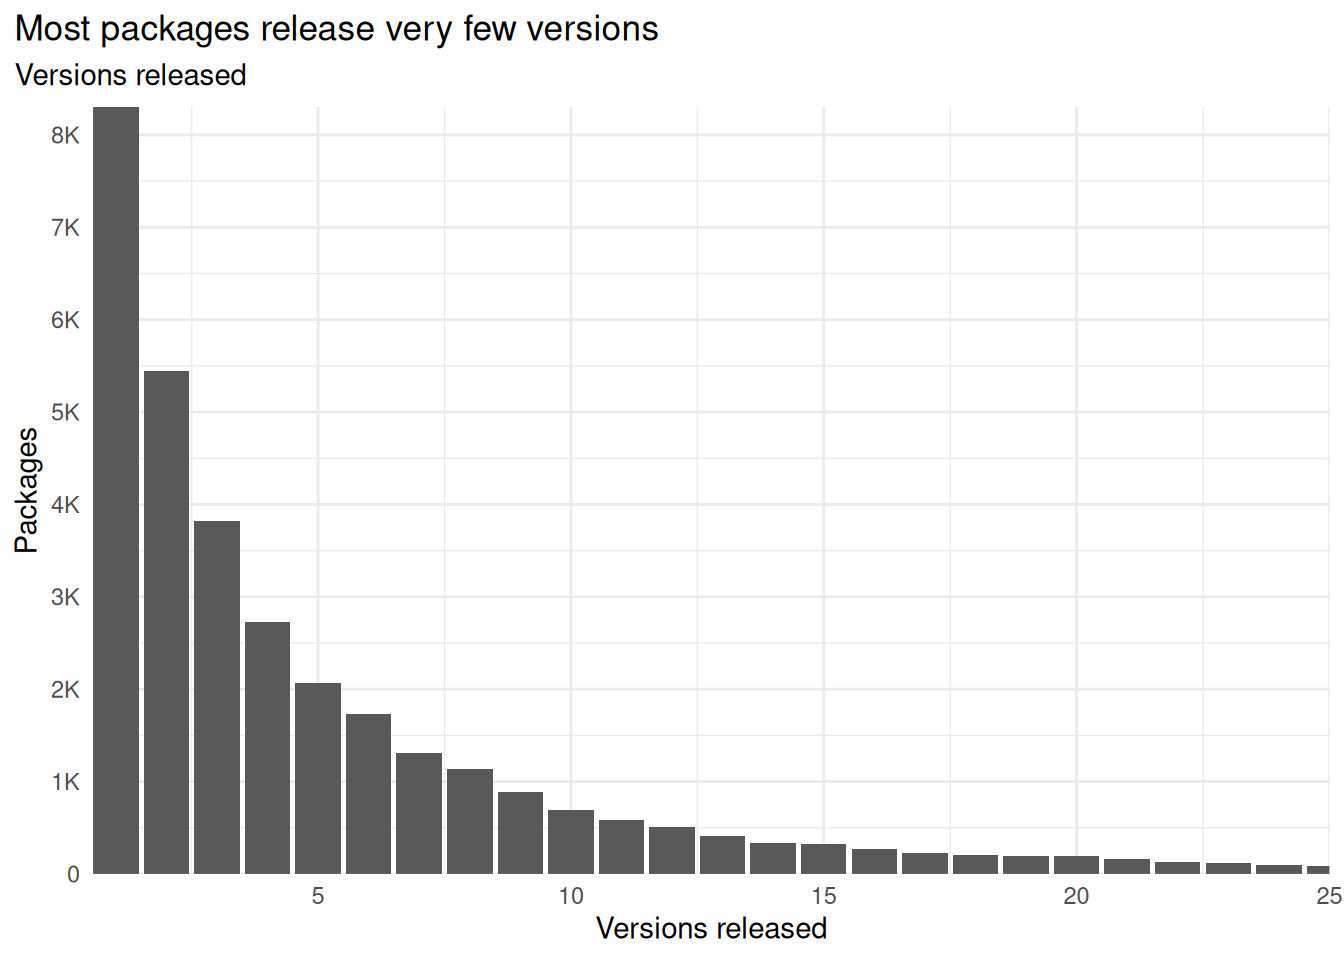
Let’s check what happens to those being checked:
archived_packages <- caa |>
  filter(.by = Package, any(Action != "publish")) |>
  arrange(Package, Date, Time) |>
  mutate(
    Time = if_else(is.na(Time), "12:00:00", Time),
    dt = as.POSIXlt(
    paste(Date, Time),
    format = "%Y-%m-%d %H:%M:%OS",
    tz = "Europe/Vienna")) |>
  arrange(dt)

ap <- archived_packages |>
  filter(Action != "remove") |>
  filter(.by = Package, lag(Action, default = "publish") != Action | Action != lead(Action, default = "publish")) |>
  filter(.by = c(Package, Version),
         (n() %% 2) == 0L,
         sum(Action == "publish") == sum(Action != "publish")) |>
  mutate(Action = factor(Action, levels = c("publish", "archive"),
                         ordered = TRUE)) |>
  arrange(Package, Version, dt, Action) |>
  mutate(.by = Package,
         ids = lag(cumsum(Action != "publish"), default = 0)) |>
  filter(.by = c(Package, ids), n() == 2L & n_distinct(Action) == 2L & first(Action) == "publish")

ap_wide <- ap |>
  select(Package, Action, ids, dt) |>
  pivot_wider(names_from = Action, values_from = dt) |>
  mutate(diff_t = difftime(archive, publish, units = "days"))

p <- ap_wide |>
  ggplot() +
  geom_histogram(aes(diff_t, group = ids, fill = ids +1), binwidth = 30) +
  scale_y_continuous(expand = expansion_0NA, labels = scales::label_number(scale_cut= cut_short_scale())) +
  scale_fill_continuous(palette = gradient_archived) +
  labs(title = "",
       subtitle = "Package time on CRAN before archiving",
       fill = "Archived",
       x = "Time (days)",
       y = "Archived versions") +
  theme_minimal() +
  theme(plot.title.position = "plot")

library("patchwork")
p +
  scale_x_continuous(expand = expansion_0NA, breaks = 0:15*365) +
  theme(legend.position = "inside",
        legend.position.inside = c(0.07, 0.7)) +
  inset_element(
    p +
      coord_cartesian(xlim = c(0, 365*2)) +
      guides(fill = "none") +
      labs(title = NULL,
           x = NULL,
           y = NULL) +
      theme(plot.background = element_rect(colour = "grey50")) +
      scale_x_continuous(expand = expansion_0NA,
                         breaks = round(c(365*c(0, .5, 1, 1.5, 2)))),
0.15, 0.2, 1, 1) 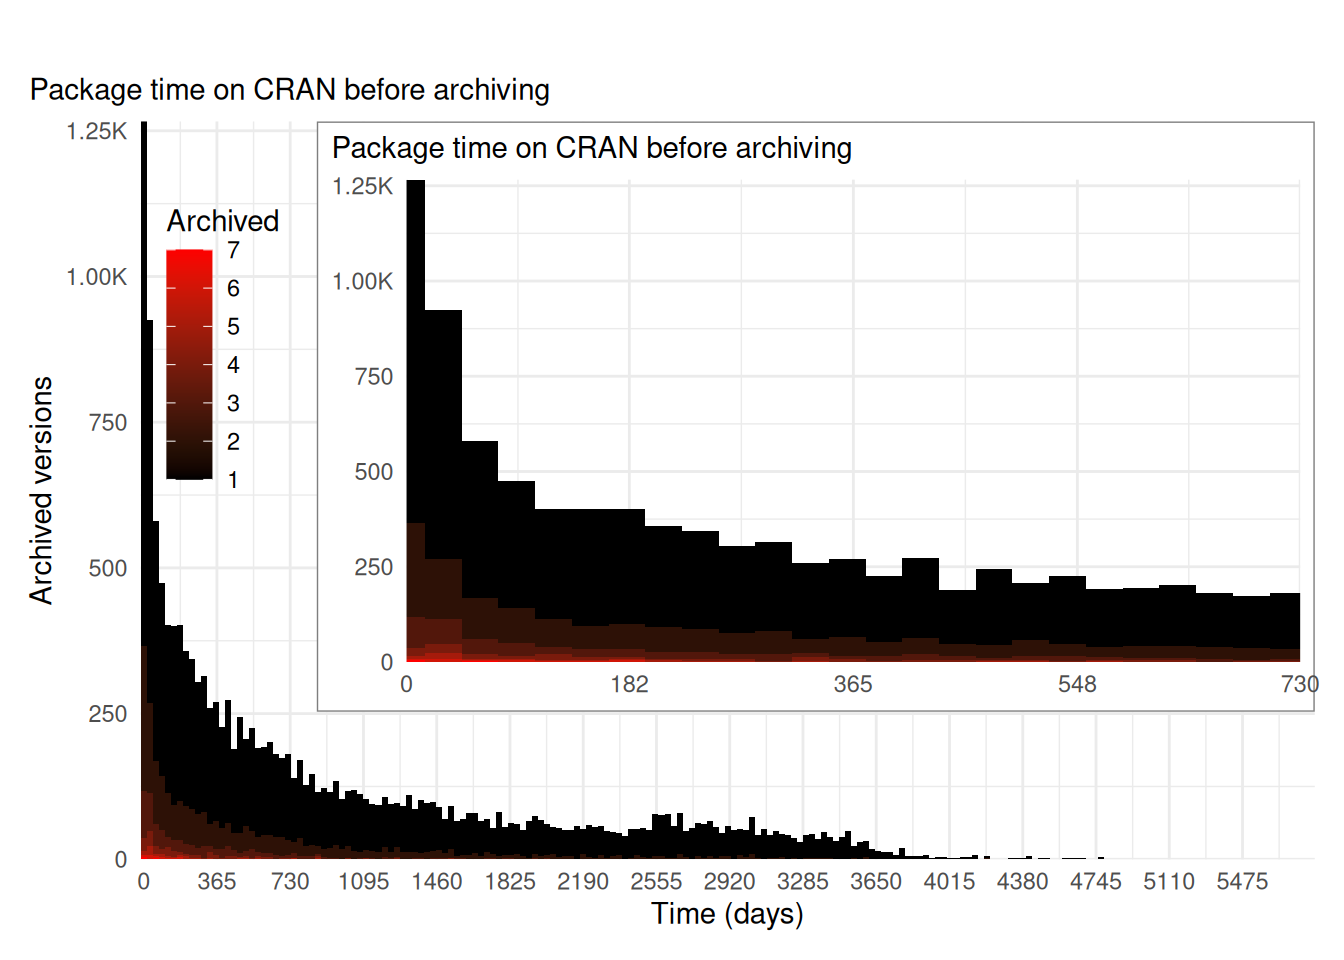
Let’s check what happens per number of archival:
ap_wide |>
  mutate(date = as.Date(archive)) |>
  ggplot() +
  geom_smooth(aes(date, diff_t, col = ids+1, group = ids +1), span = "1 month",
              method = "gam", formula = y ~ s(x, bs = "cs"), method.args = list(family = "gaussian")
              ) +
  scale_color_continuous(palette = gradient_archived) +
  scale_x_years +
  scale_y_continuous(expand = expansion_0NA, limits = c(0, NA),
                     breaks = 365*0:7, name = "Days till archiving",
                     sec.axis = dup_axis(labels = \(x){x/365},
                                         name = "Years till archiving")) +
  theme_minimal() +
  labs(title = "Archiving older versions",
       col = "Times",
       subtitle = "Time a package was available till it was archived")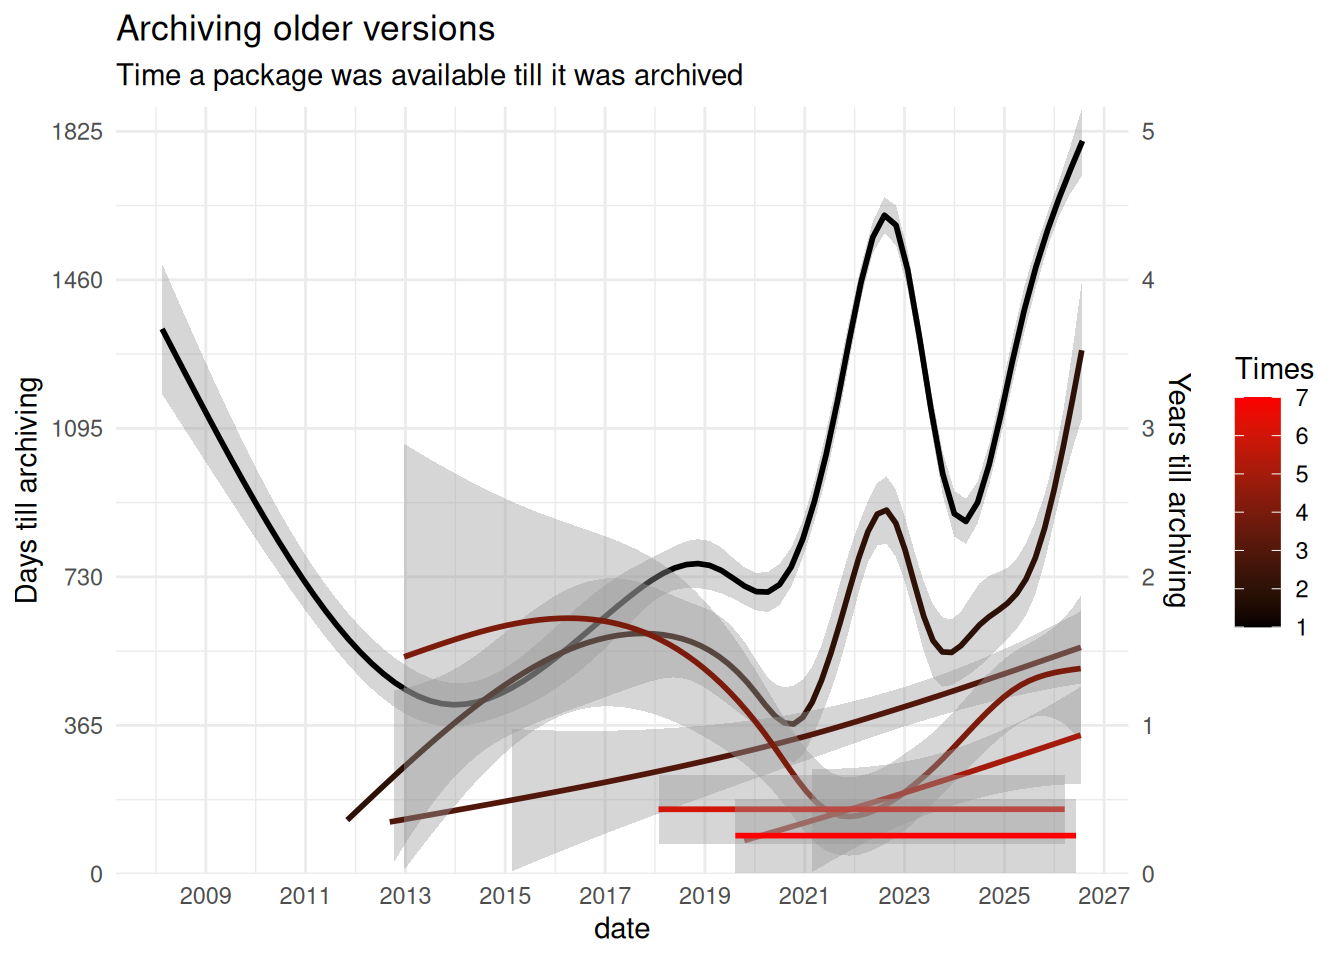
We can change the reference, instead of the date when the package was archived the date the package was published:
ap_wide |>
  mutate(date = as.Date(publish)) |>
  ggplot() +
  geom_smooth(aes(date, diff_t, col = ids+1, group = ids +1), span = "1 month",
              method = "gam", formula = y ~ s(x, bs = "cs"), method.args = list(family = "gaussian")
              ) +
  scale_color_continuous(palette = gradient_archived) +
  scale_x_years +
  scale_y_continuous(expand = expansion_0NA, limits = c(0, NA),
                     breaks = 365*0:7, name = "Days till archiving",
                     sec.axis = dup_axis(labels = \(x){x/365},
                                         name = "Years till archiving")) +
  theme_minimal() +
  labs(title = "Archiving older versions",
       col = "Times",
       subtitle = "Time a package was available till it was archived")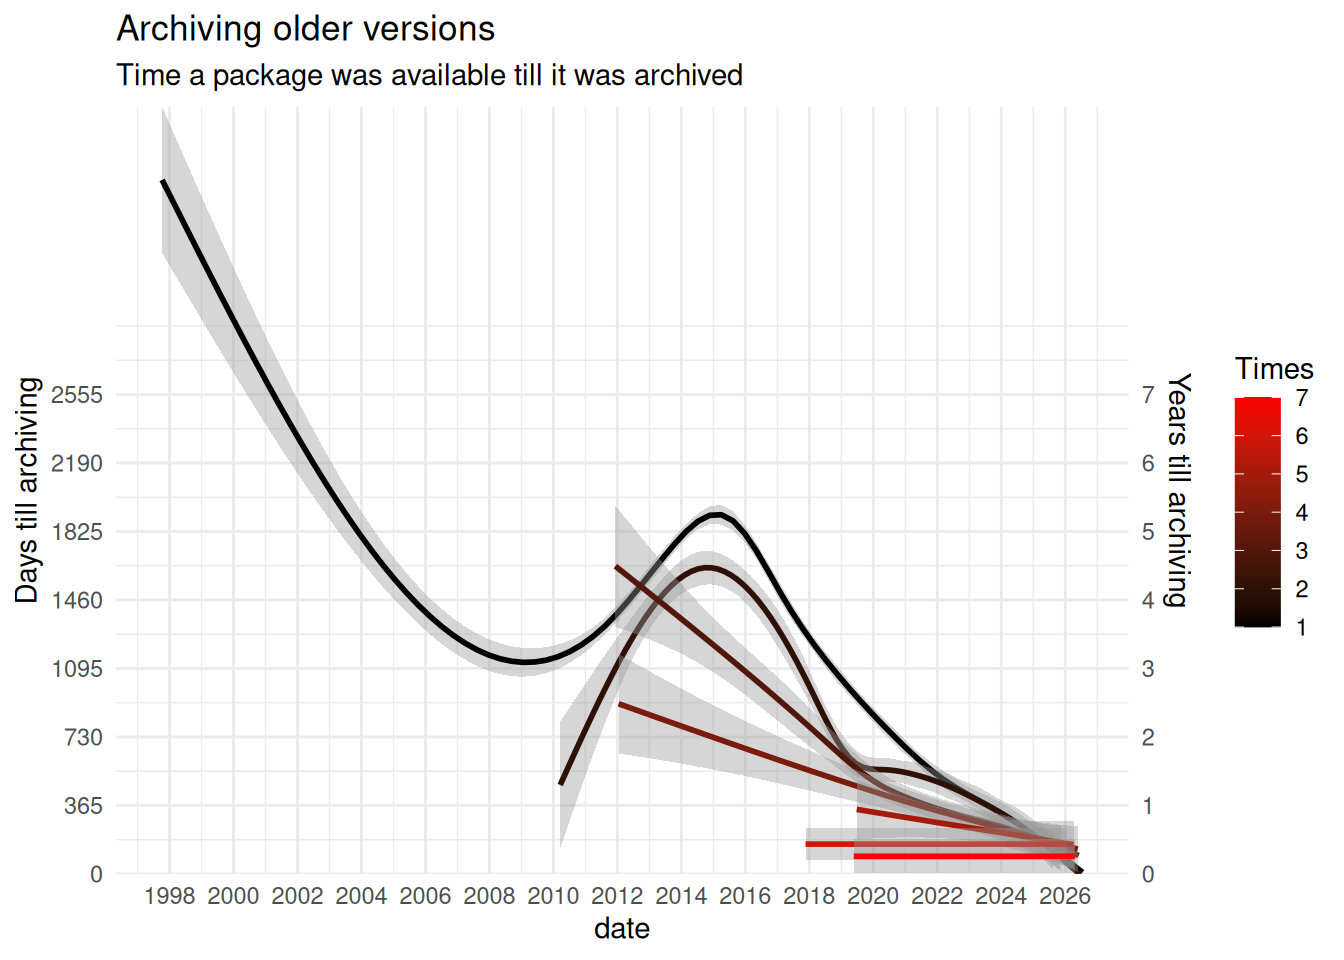
In 2022 there was a clean up of packages that affected old packages.
ap_wide |>
  arrange(archive) |>
  mutate(date = as.Date(publish)) |>
  mutate(.by = date, n = n()) |>
  ggplot() +
  geom_smooth(aes(date, diff_t), span = "1 month",
              method = "gam", formula = y ~ s(x, bs = "cs"), method.args = list(family = "gaussian")) +
  scale_colour_gradient2() +
  scale_x_years +
  scale_y_continuous(expand = expansion_0NA, limits = c(0, NA),
                     breaks = 365*0:7,
                     labels = \(x){x/365},
                     name = "Years till archiving",
                     sec.axis = dup_axis(name = NULL)) +
  theme_minimal() +
  labs(title = "Archiving older versions",
       x = NULL,
       col = "Times",
       subtitle = "Time a package was available till it was archived") +
  theme(plot.title.position = "plot")
## Ignoring unknown labels:
## • colour : "Times"
## Warning: Removed 1 row containing missing values or values outside the scale range
## (`geom_smooth()`).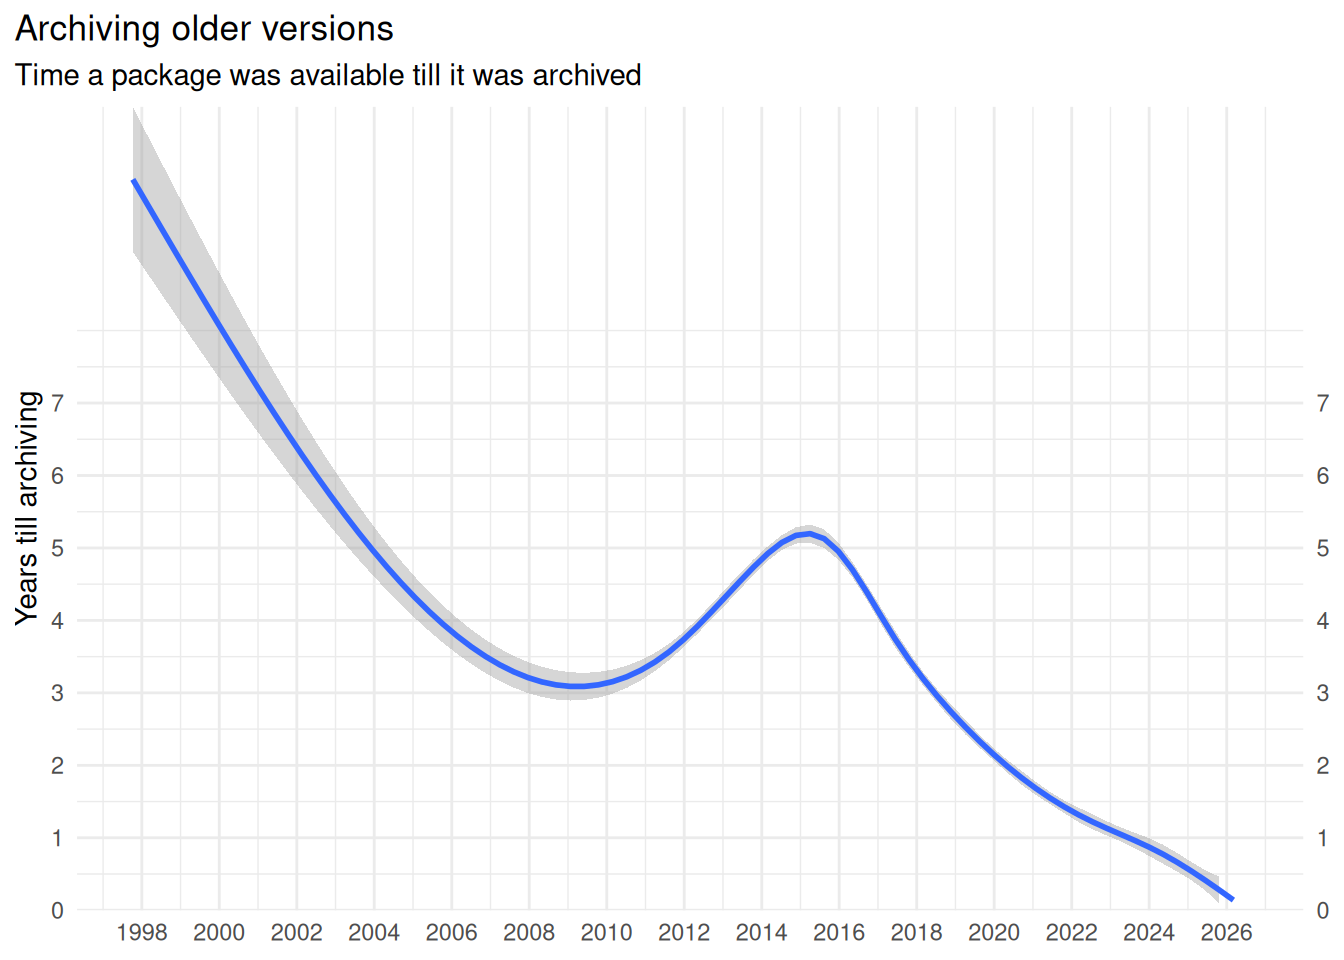
If we plot by number or archival instead we get a different (but similar) picture:
p <- ap_wide |>
  mutate(date = as.Date(publish)) |>
  ggplot() +
  geom_smooth(aes(date, diff_t, col = ids+1, group = ids),  span = "1 month",
              method = "gam", formula = y ~ s(x, bs = "cs"), method.args = list(family = "gaussian")) +
  geom_abline(slope = -1,
              intercept = as.numeric(as.Date(max(ap_wide$publish))),
              linetype = 2)+
  scale_color_continuous(palette = gradient_archived) +
  theme_minimal() +
  labs(title = "Packages are archived sooner",
       subtitle = "Time from first publication to archiving",
       col = "Times",
       y = "Time (days)",
       x = NULL)

p +
  scale_x_years +
  scale_y_continuous(expand = expansion_0NA,
                     limits = c(0, NA),
                     breaks = 365*0:11,
                     labels = \(x){x/365},
                     name = "Years till archiving") +
  theme(
    legend.position = 'inside',
    legend.position.inside = c(0.1, 0.2),
    plot.title.position = "plot",
    legend.background = element_rect(color = "black")) +
  inset_element(p +
                  coord_cartesian(
                    xlim = c(as.Date("2018-01-01"), NA),
                    ylim = c(0, 1500)) +
                  scale_y_continuous(expand = expansion_0NA,
                                     breaks = 365*0:4) +
                  labs(x = NULL,
                       y = NULL,
                       title = NULL,
                       subtitle = NULL) +
                  guides(col = "none") +
                  theme(plot.background = element_rect(colour = "grey50"))
                , 0.3, 0.5, 1, 1)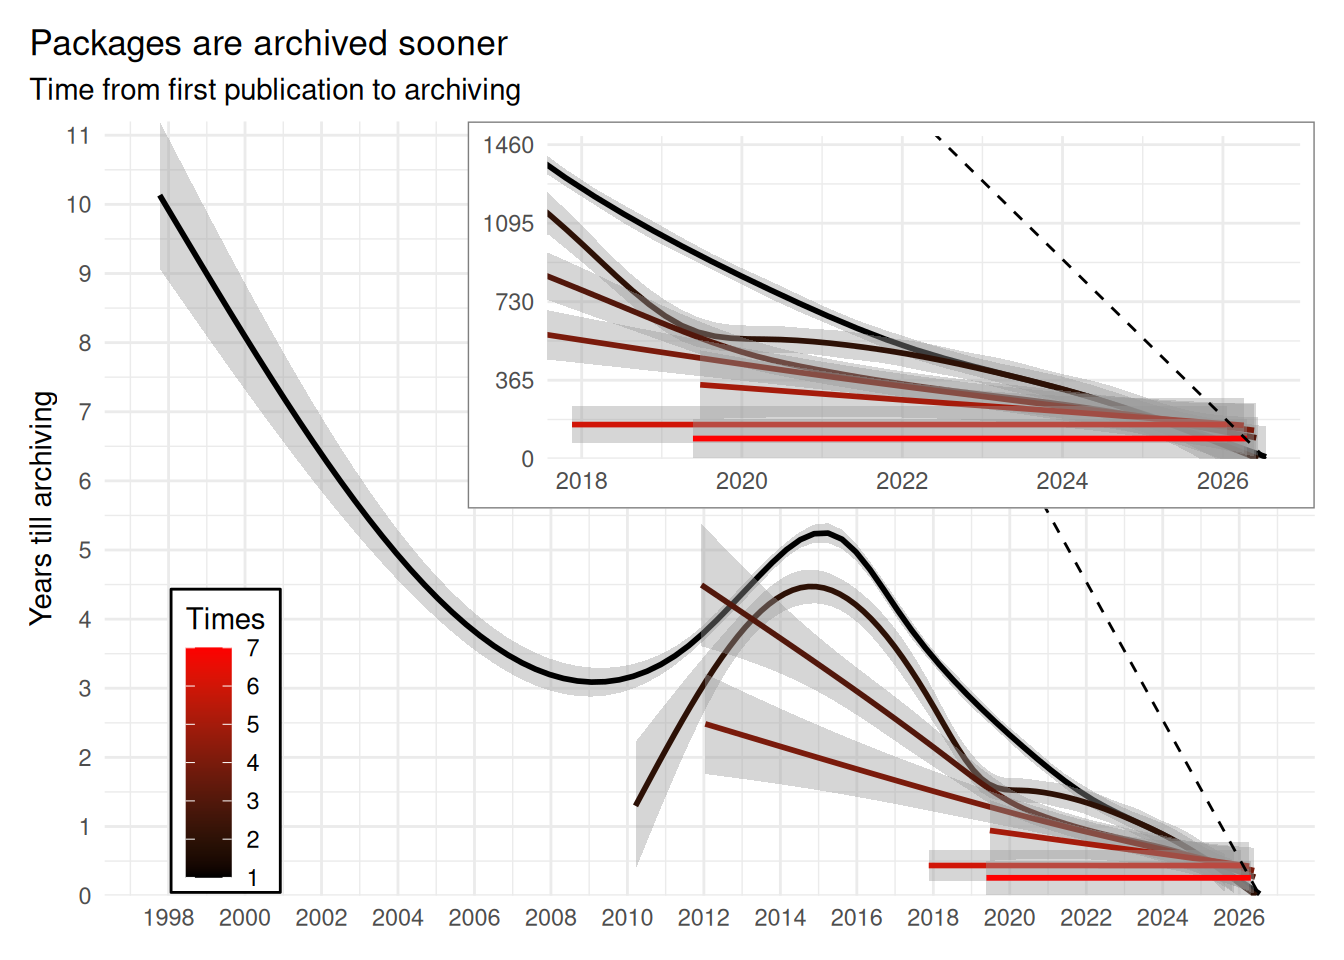
Zooming on packages being archived:
p <- ap_wide |>
  arrange(publish) |>
  mutate(date = as.Date(publish)) |>
  mutate(.by = date, n = n()) |>
  ggplot() +
  geom_smooth(aes(date, diff_t), span = "1 month",
              method = "gam", formula = y ~ s(x, bs = "cs"), method.args = list(family = "gaussian")) +
  theme_minimal() +
  geom_abline(slope = -1,
              intercept = as.numeric(as.Date(max(ap_wide$publish))),
              linetype = 2) +
  labs(title = "Packages are archived sooner",
       subtitle = "Time from publication to archiving",
       y = NULL,
       x = NULL)

p +
  scale_x_years +
  scale_y_continuous(expand = expansion_0NA,
                     limits = c(0, NA),
                     breaks = 365*seq(from = 0, to = 11, by = 2),
                     labels = function(x){paste(x/365, " years")}) +
  theme(
    legend.position = 'inside',
    legend.position.inside = c(0.2, 0.2)) +
  inset_element(p +
                  coord_cartesian(
                    xlim = c(as.Date("2022-01-01"), NA),
                    ylim = c(0, 600)) +
                  scale_y_continuous(expand = expansion_0NA,
                                     labels = function(x){paste(x, " days")},
                                     breaks = 120*0:13) +
                  labs(x = NULL,
                       y = NULL,
                       title = NULL,
                       subtitle = NULL) +
                  guides(col = "none") +
                  theme(plot.background = element_rect(colour = "grey50"))
                , 0.3, 0.5, 1, 1)
## Warning: Removed 1 row containing missing values or values outside the scale range
## (`geom_smooth()`).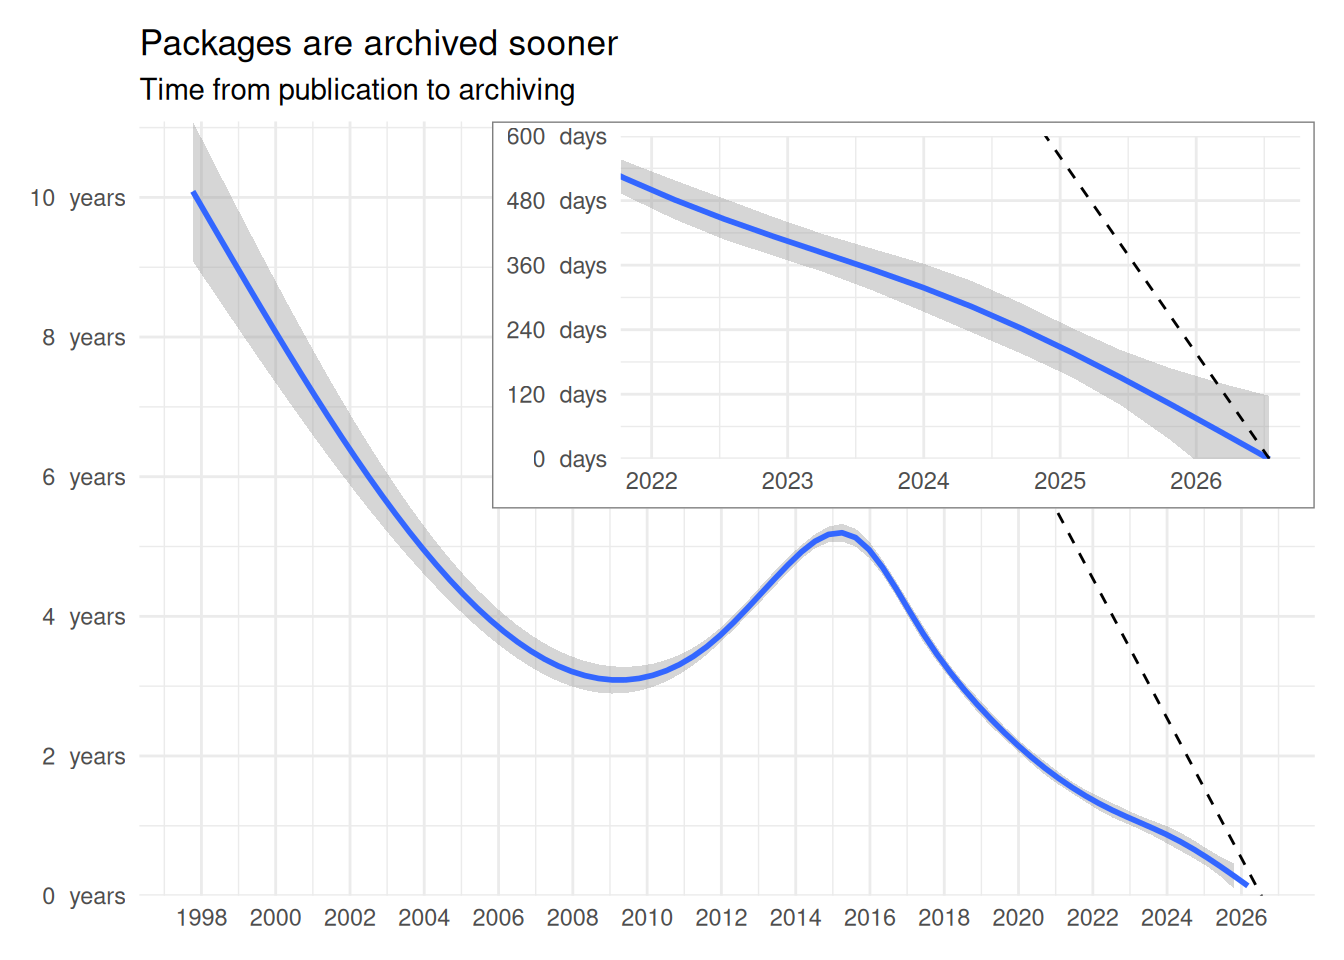
How often are packages receiving notices?
Is that easy to maintain a package on CRAN? As you might have suspected to keep a package on CRAN one needs to update it. One can do it at their own peace except when CRAN QA team detects problems on the package. Then they will set a deadline to fix those issues identified.
First, let’s clean up a bit the data:
ci <- repo.data::cran_issues()
## Warning in repo.data::cran_issues(): Correcting incorrect dates on Before

cik <- ci |>
  mutate(si = strsplit(Info, ":", fixed = TRUE),
         et = unlist(lapply(si, function(x){
           paste0(x[4:6], collapse = ":")
           })),
         Title = if_else(is.na(Title) & !startsWith(et, "NA:"), et, Title)
  ) |>
  mutate(
    Title = gsub("^(NOTE|ERROR|WARNING):?_?", "", Title, ignore.case = TRUE),
    Title = gsub("(QUERIED:?.*)$", "", Title),
    Title = if_else(!nzchar(Title), NA, Title),
    Title = tools::toTitleCase(Title),
    Title = if_else(grepl("from:(upgrade|ugprade)", Title, ignore.case = TRUE), "from upgrade", Title),
    Title = if_else(grepl("from:archival", Title, ignore.case = TRUE), "from archival", Title),
    Title = if_else(grepl(":missing:", Title, ignore.case = TRUE), "from Bioc", Title),
    Title = if_else(grepl(":?BioC", Title, ignore.case = TRUE), "from Bioc", Title),
    Title = if_else(grepl("from:sys", Title, ignore.case = TRUE), "System change", Title),
    Title = if_else(grepl("Additional_issue", ignore.case = TRUE, Title), "Additional issues", Title),
    Title = if_else(grepl("^:?web", ignore.case = TRUE, Title), "Web", Title),
    Title = if_else(grepl("^Rd_files", ignore.case = TRUE, Title), "Rd_files", Title),
    Title = if_else(grepl("^Compiled_code", ignore.case = TRUE, Title), "Compiled code", Title),
    Title = if_else(grepl("email_to_maintainer_is_undeliverable", Title, ignore.case = TRUE), "email undeliverable", Title),
    Title = if_else(grepl("4\\..:?c?", Title), "R changes", Title),
    Title = if_else(Title == "should_remove_NeedsCompilation_yes_from_DESCRIPTION", "NeedsCompilation", Title),
    # Title = if_else(Title == "C++11_specification_forcing_legacy_Armadillo", "C++11 forcing legacy Armadillo")
    Title = if_else(startsWith(Title, "needs_to_fix_DESCRIPTION"), "fix DESCRIPTION", Title),
    Title = if_else(grepl("^user_library_mount_read_only", Title, ignore.case = TRUE), "user_library_mount_read_only", Title),
    Title = if_else(startsWith(Title, "Rd_contents"), "Rd_contents", Title),
    Title = if_else(startsWith(Title, "QUERIED"), "QUERIED", Title),
    Title = if_else(grepl("oldrelease", Title, ignore.case = TRUE), "oldrelease", Title),
    Title = if_else(grepl("Rd_cross-References", Title, ignore.case = TRUE), "Rd_cross-References", Title),
    Title = if_else(grepl("Rd_\\usage", Title, fixed = TRUE), "Rd_usage", Title),
    Label = if_else(endsWith(Label, "-25"), NA, Label),
    Label = if_else(Label %in% c("RDEPENDS", "RRDEPENDS"), "RDEPENDS", Label)
         )
Now we can plot it:
cik |>
  count(Title, sort = TRUE) |>
  mutate(
    Title = forcats::fct_na_value_to_level(Title, level = NA),
    Title = forcats::fct_reorder(Title, n, .fun = sum, .desc = TRUE)) |>
  ggplot() +
  geom_col(aes(Title, n)) +
  scale_y_continuous(expand = expansion_0NA) +
  theme_minimal() +
  theme(axis.text.x = element_blank(),
        axis.ticks.x = element_blank(),
        panel.grid.minor.x = element_blank()) +
  labs(subtitle = "Common notification for requiring updates on CRAN",
       title = "Most notifications are package specific",
       x = "Reason",
       y = "Notifications")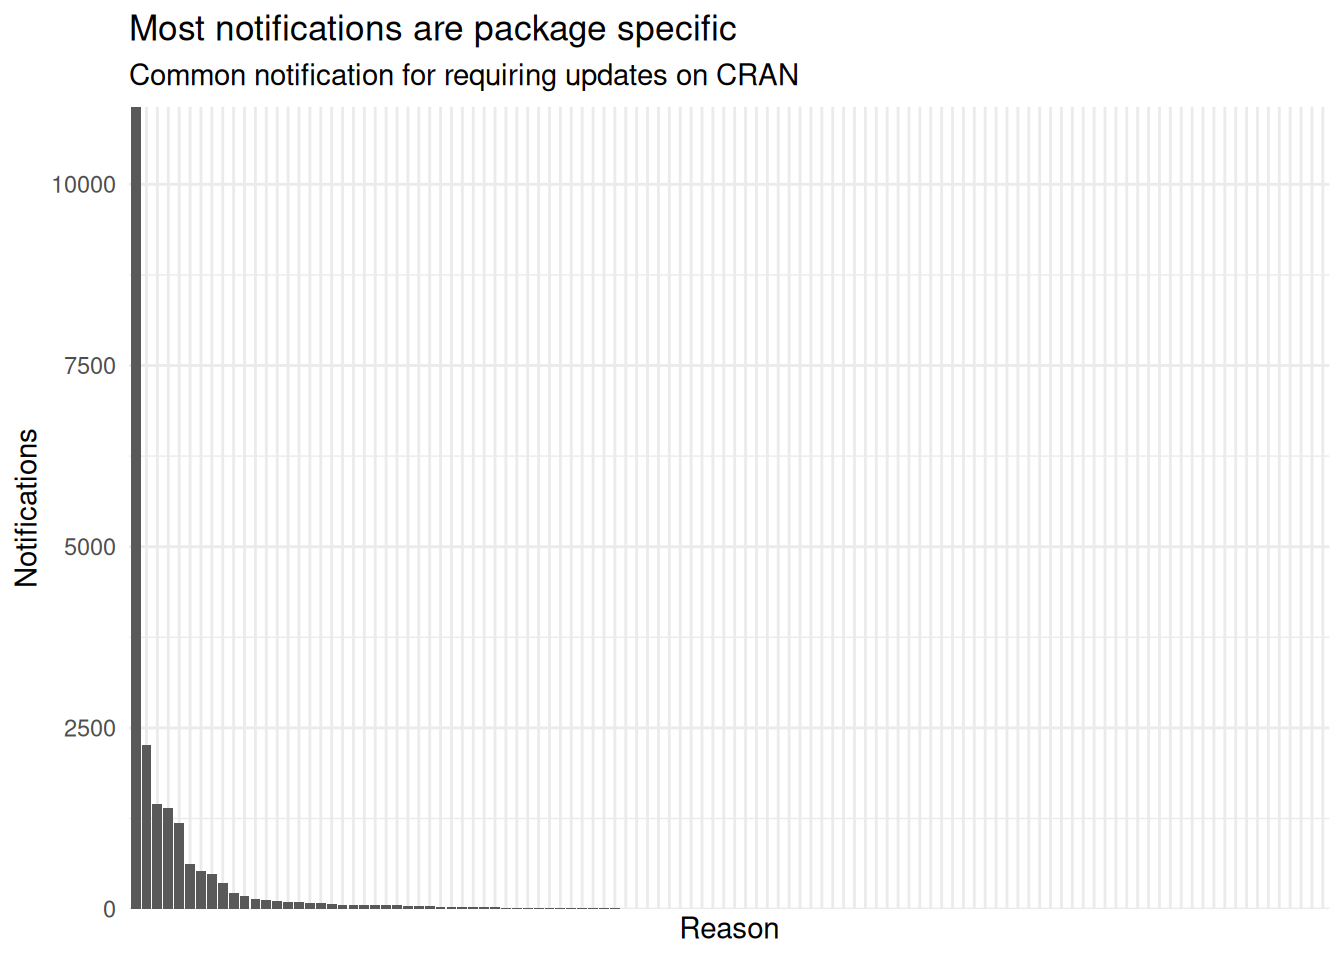
We can see that there are some reasons that are much more common than others. Cleaning it up a bit more and showing it in a readable format:
cik |>
  mutate(Title = forcats::fct_lump(Title, n = 20)) |>
  count(Title, Label, sort = TRUE) |>
  mutate(
    Title = forcats::fct_na_value_to_level(Title, level = NA),
    Title = forcats::fct_reorder(Title, n, .fun = sum),
    # Title = forcats::fct_relevel(Title, rev(levels(Title)))
    ) |>
  ggplot() +
  geom_col(aes(n, Title, fill = Label)) +
  scale_x_continuous(expand = c(0, NA)) +
  scale_fill_manual(values = c("CLOSE" = "red", "Extend" = "darkgreen", "FINAL" = "darkred", "RDEPENDS" = "orange", "REOPEN" = "green", "REVDEPS" = "darkviolet"))+
  theme_minimal() +
  labs(y = NULL,
       x = "Notifications",
       title = "Most common reasons are unkown or very particular",
       subtitle = "Notifications reasons") +
  theme(plot.title.position = "plot",
        legend.position = "inside",
        legend.position.inside = c(0.8, 0.6),
        legend.background = element_rect(color = "black"))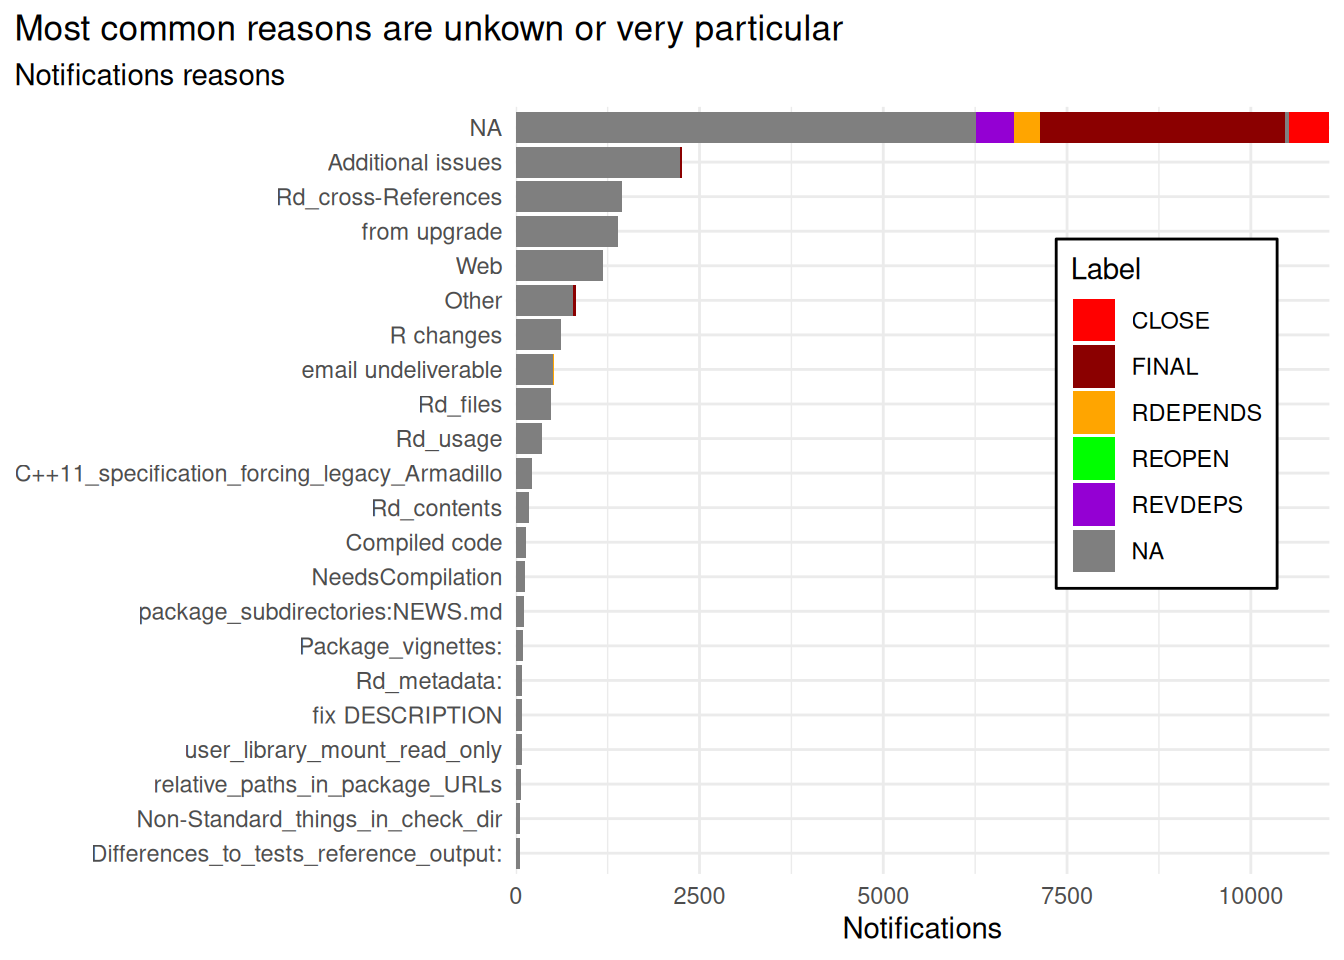
Which packages receive more notifications according to this dataset?
cik |>
  count(Package, sort = TRUE) |>
  count(n, name = "Packages") |>
  ggplot() +
  geom_area(aes(n, Packages))+
  theme_minimal() +
  scale_x_continuous(expand = expansion_0NA) +
  scale_y_log10(guide = "axis_logticks", expand = expansion_0NA) +
  labs(title = "Some packages receive a lot of notifications",
       subtitle = "Notifications per package",
       x = "Notifications") +
  theme(plot.title.position = "plot")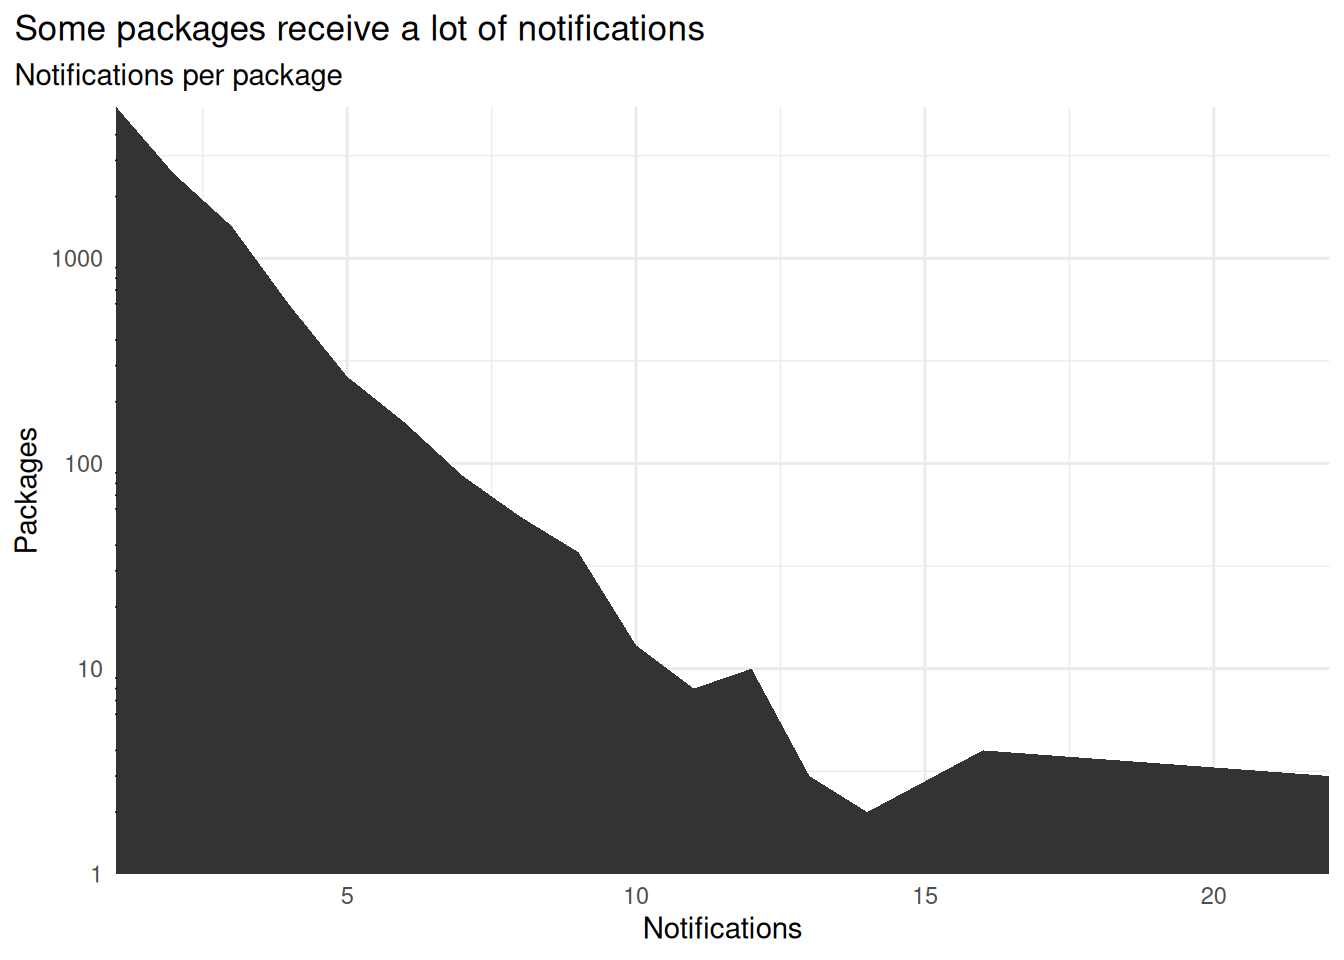
Having seen that are some packages that get more notifications than others, how is it distributed with time?
cik |>
  mutate(Date = as.Date(Date)) |>
  summarise(.by = c(Date), n = n()) |>
  ggplot() +
  # geom_point(aes(Date, n)) +
  # coord_cartesian(ylim = c(0, 100)) +
  geom_smooth(aes(Date, n), span = "1 month", method = "gam",
              formula = y ~ s(x, bs = "cs"), method.args = list(family = "poisson")) +
  theme_minimal() +
  labs(title = "There has been a peak of notifications",
       subtitle = "Daily notifications per date",
       x = NULL,
       y = "Notifications") +
  theme(plot.title.position = "plot")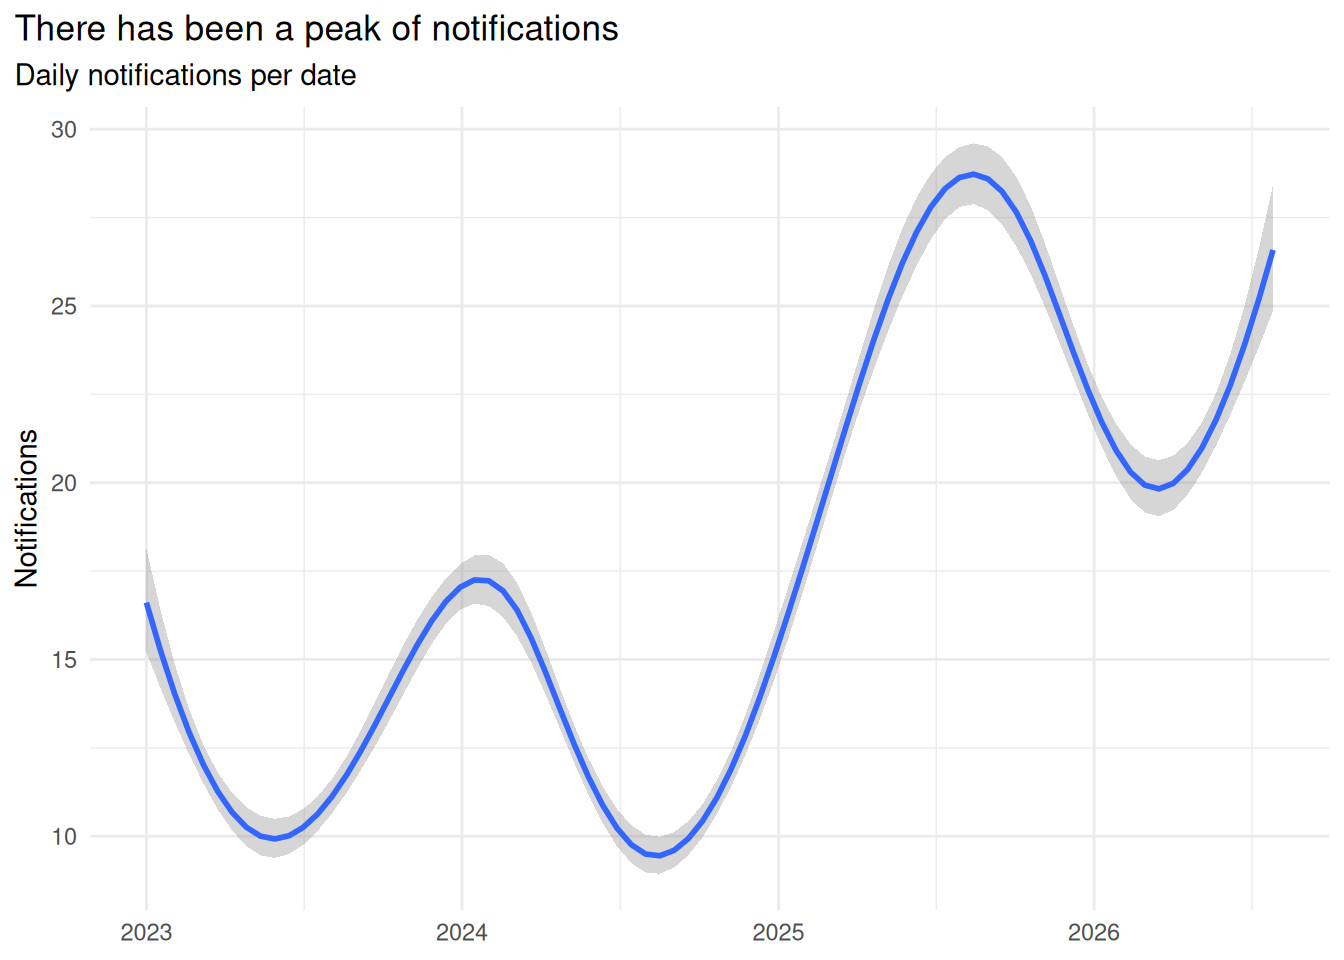
Notifications sent to pacakges by date.
What is the relationship within packages?
On a previous post I analyzed the links of packages and found that some R help pages linked to themselves. How often does this happen on packages? How common is to only link to their own help pages and no external help pages?
Also note that many issues with packages are related to R documentation.
cpl <- cran_pkges_links()
## Downloading and caching CRAN's packages xrefs for this session.
## Downloading and caching base R's aliases for this session.
## Warning: Packages with targets not present in a OS:
## 'base', 'grDevices', 'parallel'
## Downloading and caching CRAN aliases for this session.
## Warning: Packages with targets not present in a OS:
## 'sfsmisc'
## Warning: Some links are distinct depending on the OS.
cpl <- as.data.frame(cpl)
cpl$n <- as.numeric(cpl$n)
BASE <- tools::standard_package_names()$base
cpl |>
  summarise(.by = from_pkg, not_self = !any(from_pkg %in% to_pkg)) |>
  count(not_self) |>
  ggplot() +
  geom_col(aes(not_self, n, fill = not_self)) +
  theme_minimal() +
  scale_y_continuous(labels = scales::label_number(scale_cut = scales::cut_short_scale()),
              expand = expansion_0NA) +
  scale_x_discrete(expand = expansion(), labels = c("No link to itself", "Links to itself")) +
  guides(fill = "none") +
  labs(
    title = "Many packages do not link to themselves",
    subtitle = "Links from help pages to other pages of the same package",
    x = NULL,
    y = "Packages") +
  theme(plot.title.position = "plot")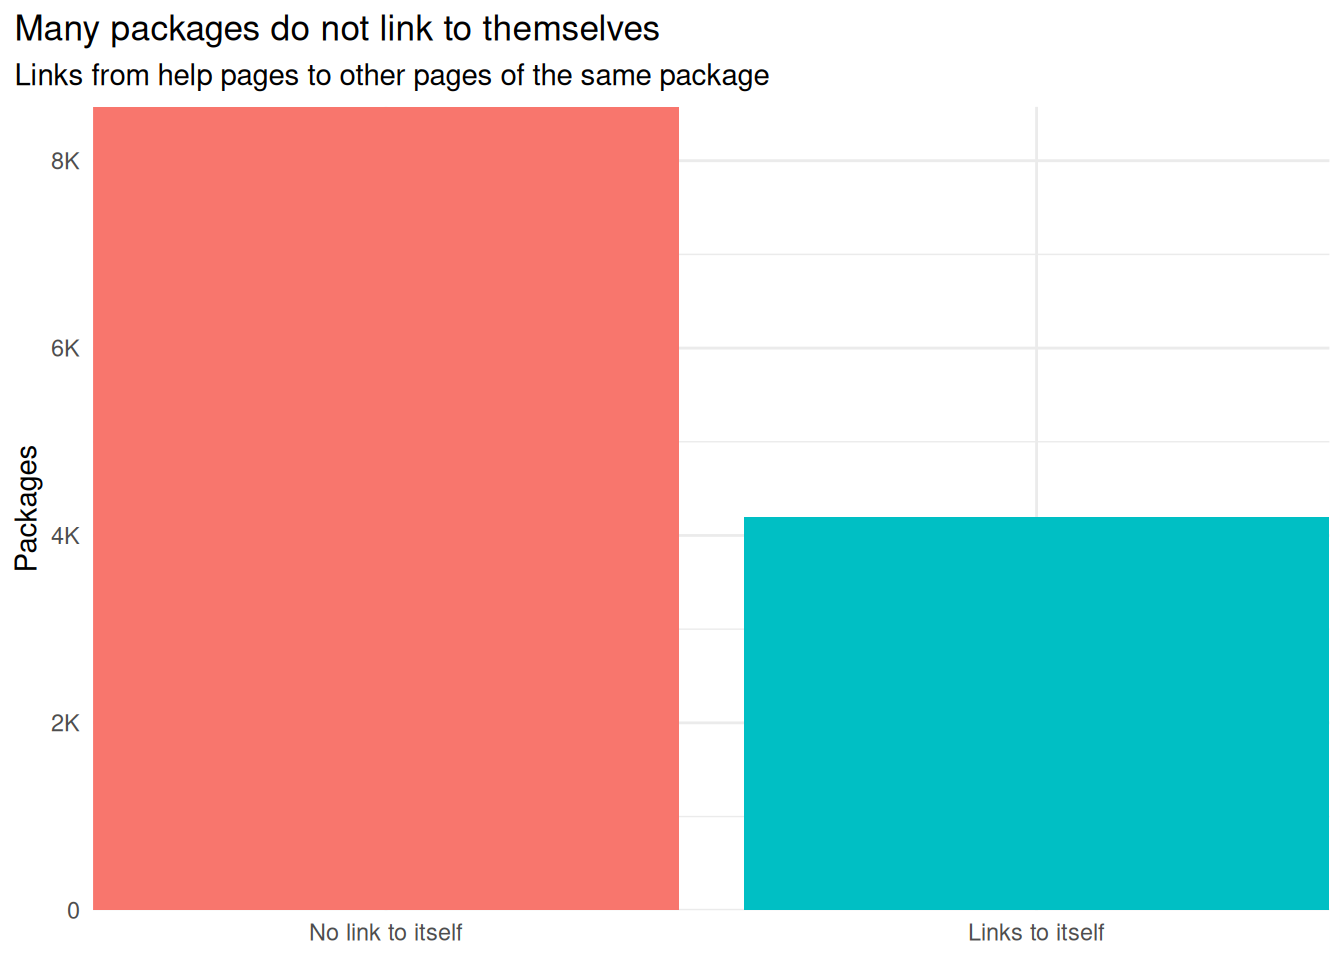
How do package link to other packages?
ap <- available.packages()
cpl2 <- filter(cpl,
               !is.na(to_pkg),
               to_pkg %in% rownames(ap),
               from_pkg %in% rownames(ap),
               !to_pkg %in% c("R", BASE))

fp <- cpl2 |>
  summarise(.by = from_pkg, n = sum(n)) |>
  arrange(desc(n)) |>
  pull(from_pkg)
cpl2 |>
  mutate(
    from_pkg = factor(from_pkg, levels = rev(fp)),
    to_pkg = factor(to_pkg, levels = fp)) |>
  filter(!is.na(to_pkg)) |>
  droplevels() |>
  # mutate(from_pkg = forcats::fct_reorder(from_pkg, n, .fun = sum, .desc = TRUE),
  #        to_pkg = forcats::fct_reorder(to_pkg, n, .fun = sum, .desc = TRUE)) |>
  ggplot() +
  geom_point(aes(from_pkg, to_pkg, size = n, col = as.character(from_pkg) == as.character(to_pkg))) +
  scale_size_binned_area(breaks = c(3, 10, 500, 1000, 2000)) +
  scale_color_manual(values = c("TRUE" = "blue", "FALSE" = "black"),
                     labels = c("TRUE" = "Self", "FALSE" = "Other"),
                     name = NULL) +
  theme_minimal() +
  theme(
    axis.text.x = element_blank(),
    axis.ticks.x = element_blank(),
    axis.text.y = element_blank(),
    axis.ticks.y = element_blank(),
    panel.grid = element_blank()
    ) +
labs(
  title = "Linking packages by the documentation",
  subtitle = "Packages with cross-references to CRAN packages",
  x = "From",
  size = "Links",
  y  = "To") +
  theme(plot.title.position = "plot")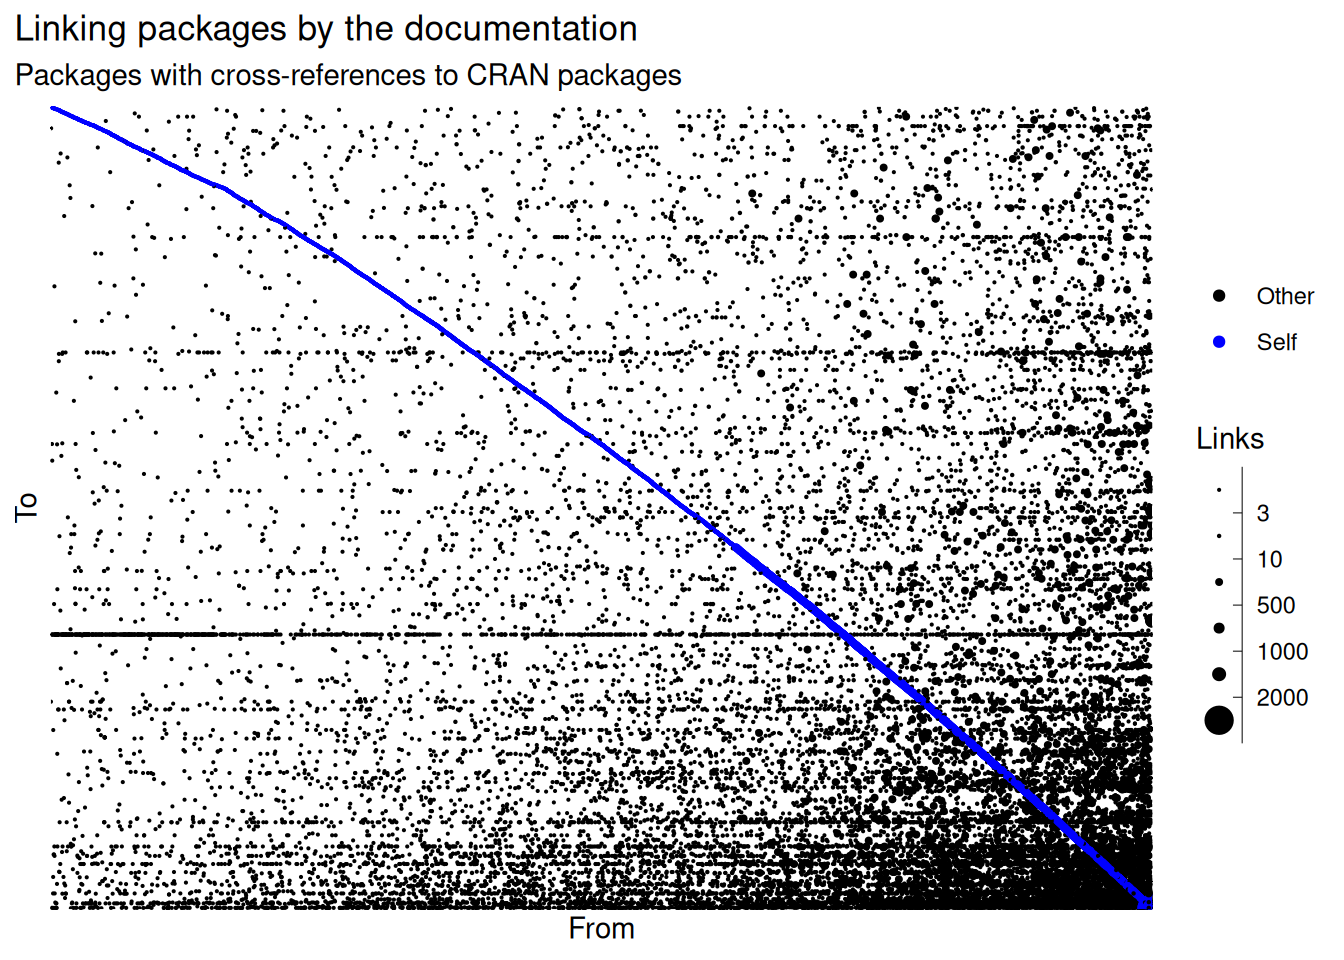
What is the relationship between packages?
While many packages have dependencies many don’t have one, or their dependencies might be on other repositories. Even if they have a dependency with other packages do they link to them or just use without any further reference?
pd <- package_dependencies(NULL)
## Warning: Some dependencies (131) are not on available repositories. Check for 'Additional_repositories' or other repositories (Bioconductor.org?):
## 'XVector', 'vsn', 'VariantAnnotation', 'UCell', 'tximport', 'tweeDEseq', 'TSCAN', 'TreeSummarizedExperiment', 'treeio', 'sva', 'survcomp', 'SummarizedExperiment', 'STRINGdb', 'SpatialExperiment', 'sparseMatrixStats', 'SparseArray', 'snpStats', 'SNPRelate', 'singscore', 'SingleCellExperiment', 'siggenes', 'ShortRead', 'seqLogo', 'scuttle', 'scran', 'scater', 'S4Vectors', 'rtracklayer', 'Rsamtools', 'Rhtslib', 'Rhdf5lib', 'rhdf5', 'Rgraphviz', 'Rdisop', 'RCy3', 'RBGL', 'R4RNA', 'qvalue', 'qusage', 'QSutils', 'qpgraph', 'pwalign', 'preprocessCore', 'phyloseq', 'Pedixplorer', 'pcaMethods', 'pathview', 'multtest', 'MultiAssayExperiment', 'MLInterfaces', 'mixOmics', 'minet', 'microbiome', 'Mfuzz', 'metapod', 'MetaboCoreUtils', 'MatrixGenerics', 'MAST', 'MassSpecWavelet', 'maftools', 'M3C', 'limma', 'LEA', 'KEGGREST', 'IRanges', 'InteractiveComplexHeatmap', 'InteractionSet', 'impute', 'Icens', 'HiCParser', 'Heatplus', 'HDF5Array', 'GWASTools', 'GSVA', 'GSEABase', 'graphite', 'graph', 'globaltest', 'GlobalAncova', 'glmSparseNet', 'ggtree', 'ggmsa', 'ggkegg', 'ggbio', 'GEOquery', 'GenomicRanges', 'GenomicFeatures', 'GenomicAlignments', 'GenomeInfoDb', 'genefilter', 'gdsfmt', 'fmrs', 'fmcsR', 'fgsea', 'ensembldb', 'EmpiricalBrownsMethod', 'edgeR', 'EBImage', 'DNAcopy', 'diffHic', 'DESeq2', 'DelayedMatrixStats', 'DelayedArray', 'DECIPHER', 'dada2', 'csaw', 'coRdon', 'ConsensusClusterPlus', 'CompoundDb', 'ComplexHeatmap', 'clusterProfiler', 'ChemmineR', 'BSgenome', 'bluster', 'Biostrings', 'biomaRt', 'biocViews', 'BiocStyle', 'BiocParallel', 'BiocGenerics', 'BiocFileCache', 'Biobase', 'aroma.light', 'AnnotationHub', 'AnnotationFilter', 'AnnotationDbi', 'annotate', 'ALDEx2', 'affyPLM', 'affy', 'a4Core'
direct_deps <- pd |>
  summarise(.by = Package, pkgs =sum(!Name %in% c("R", BASE))) |>
  filter(pkgs != 0L)

indirect_deps <- pd |>
  filter(!Name %in% c("R", BASE)) |>
  summarise(.by = Name, rev = n())
ap <- available.packages()
lj <- left_join(direct_deps, indirect_deps,
          by = join_by(Package == Name)) |>
  mutate(rev = if_else(is.na(rev), 0L, rev))

deps_counts <- lj |>
  filter(Package %in% rownames(ap)) |>
  count(rev, pkgs, sort = TRUE)

dc <- deps_counts |>
  rbind(c(rev = 0L, pkgs = 0L, n = nrow(ap) - sum(deps_counts$n)))
ann <- filter(lj,
              rev > -25*pkgs + 1000,
              rev > 0)
Most packages have some dependencies:
dc |>
  select(pkgs, n) |>
  tidyr::uncount(weights = n) |>
  ggplot(aes(pkgs)) +
  stat_ecdf(geom = "step") +
  coord_cartesian(xlim = c(0, 20)) +
  scale_x_continuous(expand = expansion_0NA, breaks = 0:20) +
  scale_y_continuous(expand = expansion_0NA, labels = scales::label_percent())  +
  theme_minimal() +
  labs(title = "Many packages have some dependencies",
       subtitle = "ECDF of dependencies",
       x = "Dependencies",
       y = NULL)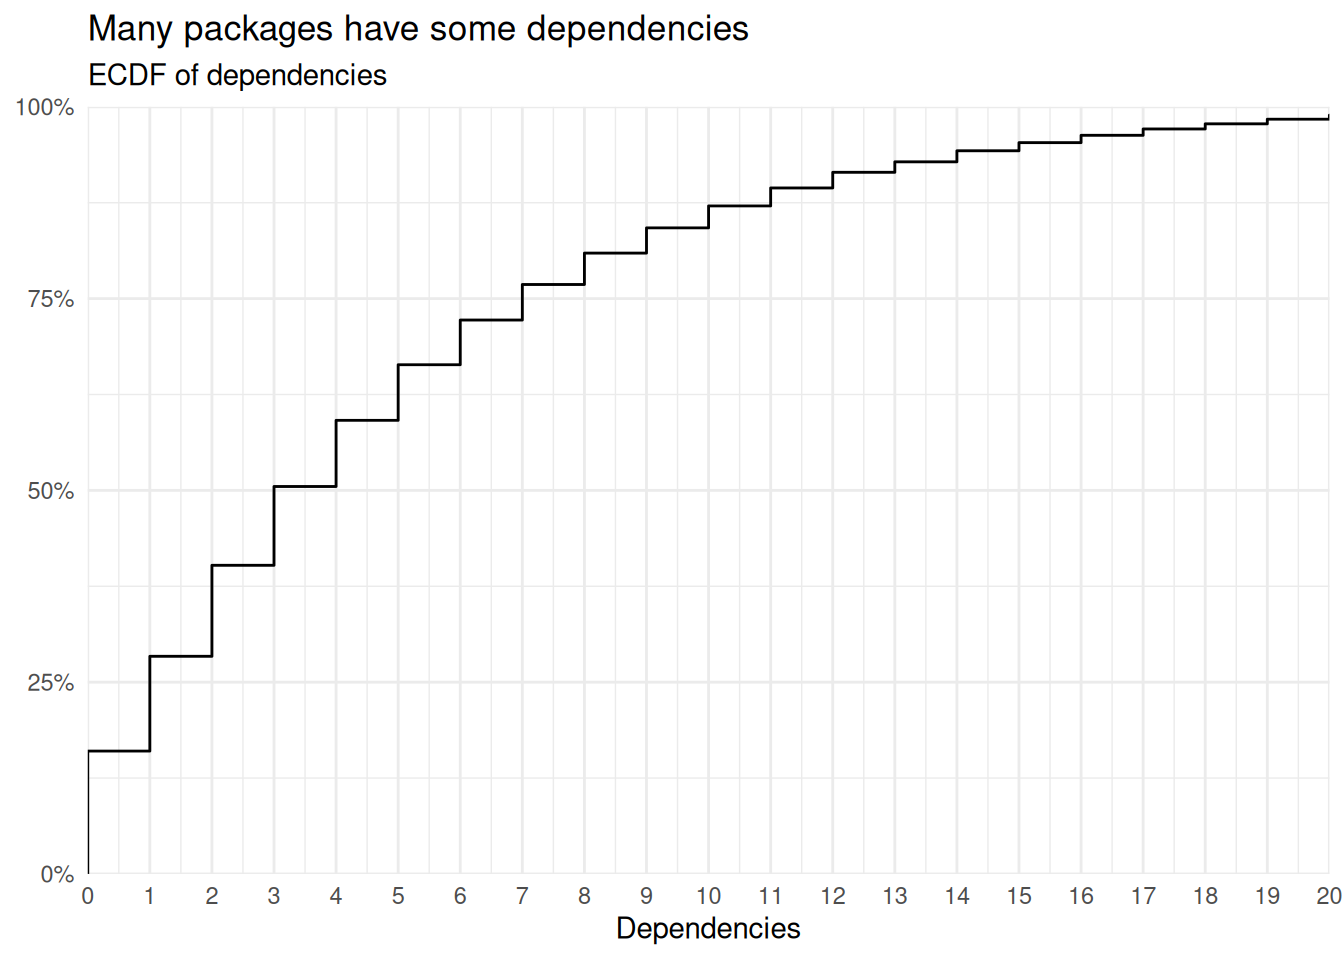
But it is less common to have someone depend on your package:
dc |>
  tidyr::uncount(n) |>
  ggplot(aes(rev)) +
  stat_ecdf(geom = "step") +
  coord_cartesian(xlim = c(0, 10)) +
  scale_x_continuous(expand = expansion_0NA, breaks = 0:10) +
  scale_y_continuous(expand = expansion_0NA, labels = scales::label_percent())  +
  theme_minimal() +
  labs(title = "Most packages have no reverse dependencies",
       subtitle = "ECDF of reverse dependencies",
       x = "Reverse dependencies",
       y = NULL)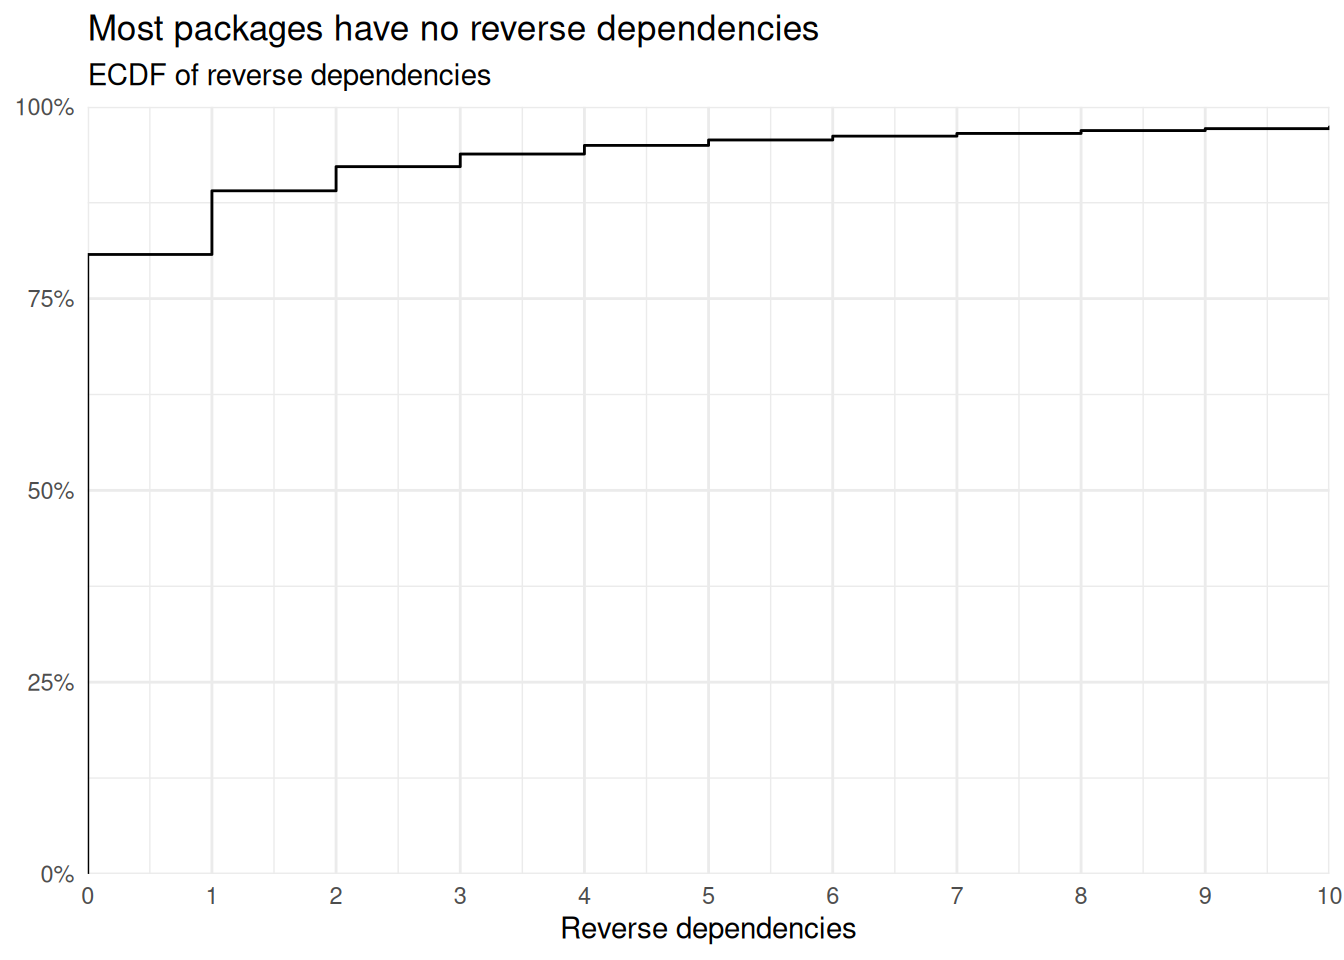
While checking dependencies is more common, most packages maintainers do not need to worry about reverse dependency checks, as less than 25% have a strong dependency.
We can see these two distributions in a different way:
dc |>
  ggplot() +
  geom_point(aes(pkgs, rev, size = n)) +
  geom_text_repel(data = ann, aes(pkgs, rev, label = Package)) +
  # geom_abline(slope = -25, intercept = 900) +
  scale_y_continuous(trans = pseudo_log_trans(base = 10),
                     breaks = c(0, 1, 10, 100, 1000, 5000)) +
  # scale_size_area(breaks = c(1, 1000, 2000)) +
  scale_size_binned_area(breaks = c(5, 10, 30, 100, 1000, 2000)) +
  theme_minimal() +
  # geom_
  guides(y = guide_axis_logticks()) +
  labs(x = "CRAN dependencies", y = "Used by", size = "Packages",
       title = "Packages dependencies on CRAN",
       subtitle = "Relationship between dependencies and reverse dependencies") +
  theme(plot.title.position = "plot")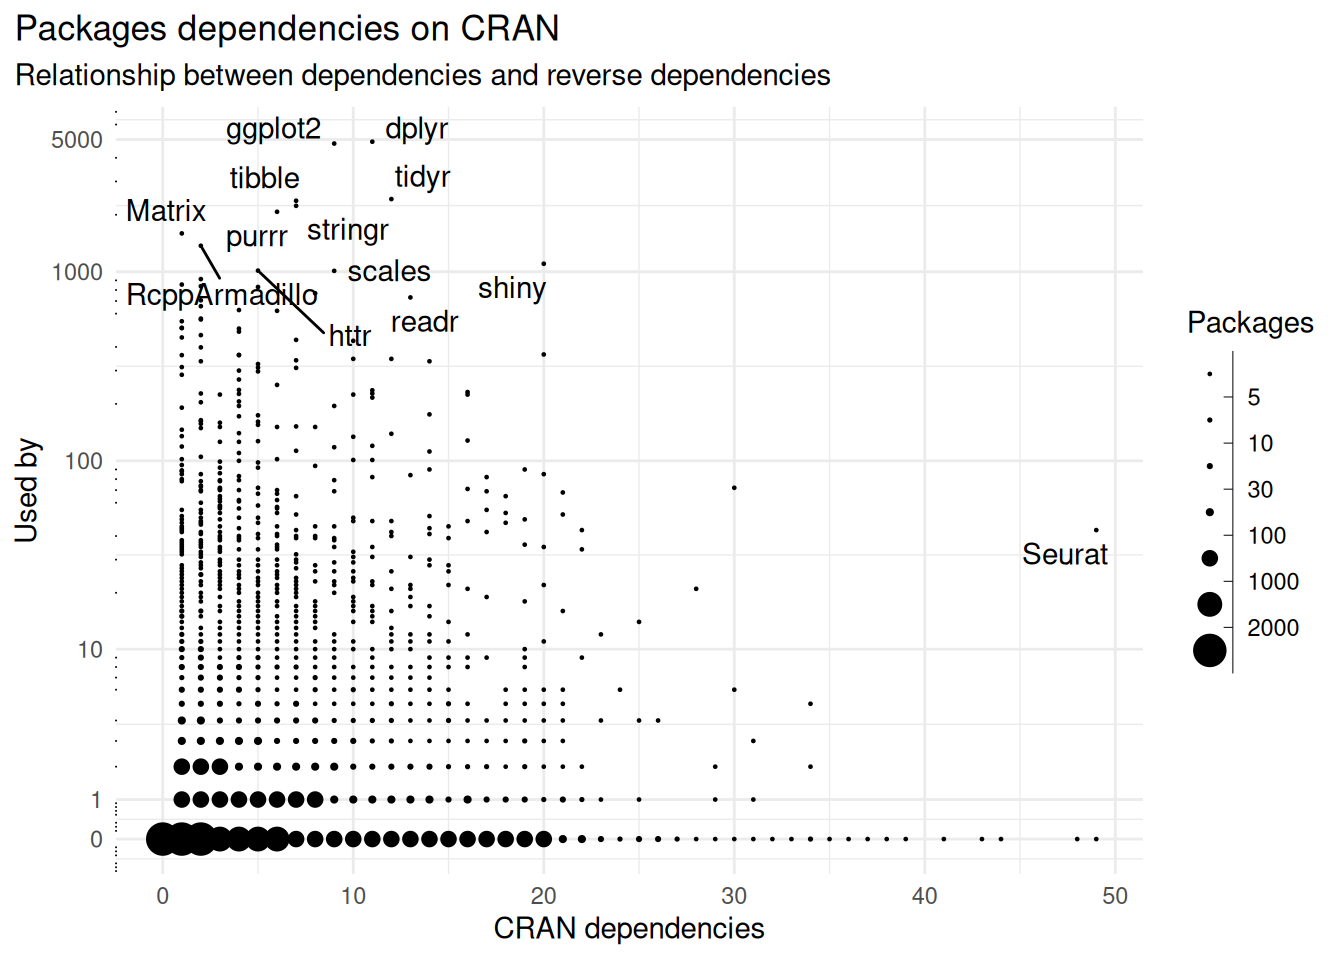
Popular packages have many dependencies while most packages have dependencies but not many reverse dependencies.
Reproducibility
## ─ Session info ───────────────────────────────────────────────────────────────────────────────────────────────────────
##  setting  value
##  version  R version 4.6.1 (2026-06-24)
##  os       Slimbook OS
##  system   x86_64, linux-gnu
##  ui       X11
##  language en
##  collate  en_US.UTF-8
##  ctype    en_US.UTF-8
##  tz       Europe/Madrid
##  date     2026-07-27
##  pandoc   3.8.3 @ /usr/lib/rstudio/resources/app/bin/quarto/bin/tools/x86_64/ (via rmarkdown)
##  quarto   1.9.38 @ /usr/lib/rstudio/resources/app/bin/quarto/bin/quarto
##
## ─ Packages ───────────────────────────────────────────────────────────────────────────────────────────────────────────
##  package      * version   date (UTC) lib source
##  blogdown       1.24      2026-06-19 [1] CRAN (R 4.6.0)
##  bookdown       0.47      2026-06-16 [1] CRAN (R 4.6.0)
##  bslib          0.11.0    2026-05-16 [1] CRAN (R 4.6.0)
##  cachem         1.1.0     2024-05-16 [1] RSPM
##  cli            3.6.6     2026-04-09 [1] CRAN (R 4.6.0)
##  digest         0.6.39    2025-11-19 [1] RSPM
##  dplyr        * 1.2.1     2026-04-03 [1] CRAN (R 4.6.0)
##  evaluate       1.0.5     2025-08-27 [1] RSPM
##  farver         2.1.2     2024-05-13 [1] CRAN (R 4.6.0)
##  fastmap        1.2.0     2024-05-15 [1] RSPM
##  forcats        1.0.1     2025-09-25 [1] CRAN (R 4.6.0)
##  generics       0.1.4     2025-05-09 [1] CRAN (R 4.6.0)
##  ggplot2      * 4.0.3     2026-04-22 [1] CRAN (R 4.6.0)
##  ggrepel      * 0.9.8     2026-03-17 [1] CRAN (R 4.6.0)
##  glue           1.8.1     2026-04-17 [1] CRAN (R 4.6.0)
##  gtable         0.3.6     2024-10-25 [1] CRAN (R 4.6.0)
##  htmltools      0.5.9     2025-12-04 [1] RSPM
##  jquerylib      0.1.4     2021-04-26 [1] RSPM
##  jsonlite       2.0.0     2025-03-27 [1] RSPM
##  knitr          1.51      2025-12-20 [1] RSPM
##  labeling       0.4.3     2023-08-29 [1] CRAN (R 4.6.0)
##  lattice        0.22-9    2026-02-09 [2] CRAN (R 4.6.1)
##  lifecycle      1.0.5     2026-01-08 [1] RSPM
##  magrittr       2.0.5     2026-04-04 [1] CRAN (R 4.6.0)
##  Matrix         1.7-5     2026-03-21 [2] CRAN (R 4.6.1)
##  mgcv           1.9-4     2025-11-07 [2] CRAN (R 4.6.1)
##  nlme           3.1-169   2026-03-27 [2] CRAN (R 4.6.1)
##  otel           0.2.0     2025-08-29 [1] RSPM
##  patchwork    * 1.3.2     2025-08-25 [1] CRAN (R 4.6.0)
##  pillar         1.11.1    2025-09-17 [1] RSPM
##  pkgconfig      2.0.3     2019-09-22 [1] RSPM
##  purrr          1.2.2     2026-04-10 [1] CRAN (R 4.6.0)
##  R6             2.6.1     2025-02-15 [1] RSPM
##  RColorBrewer   1.1-3     2022-04-03 [1] CRAN (R 4.6.0)
##  Rcpp           1.1.1-1.1 2026-04-24 [1] CRAN (R 4.6.0)
##  repo.data    * 0.2.2     2026-06-20 [1] CRAN (R 4.6.0)
##  rlang          1.2.0     2026-04-06 [1] CRAN (R 4.6.0)
##  rmarkdown      2.31      2026-03-26 [1] CRAN (R 4.6.0)
##  rstudioapi     0.18.0    2026-01-16 [1] RSPM
##  S7             0.2.2     2026-04-22 [1] CRAN (R 4.6.0)
##  sass           0.4.10    2025-04-11 [1] RSPM
##  scales       * 1.4.0     2025-04-24 [1] CRAN (R 4.6.0)
##  sessioninfo    1.2.3     2025-02-05 [1] RSPM
##  tibble         3.3.1     2026-01-11 [1] RSPM
##  tidyr        * 1.3.2     2025-12-19 [1] CRAN (R 4.6.0)
##  tidyselect     1.2.1     2024-03-11 [1] CRAN (R 4.6.0)
##  vctrs          0.7.3     2026-04-11 [1] CRAN (R 4.6.0)
##  withr          3.0.2     2024-10-28 [1] RSPM
##  xfun           0.57      2026-03-20 [1] CRAN (R 4.6.0)
##  yaml           2.3.12    2025-12-10 [1] RSPM
##
##  [1] /home/lluis/bin/R/4.6
##  [2] /opt/R/4.6.1/lib/R/library
##  * ── Packages attached to the search path.
##
## ──────────────────────────────────────────────────────────────────────────────────────────────────────────────────────