PII fines
From some time I’ve been following a company that uses data to explain some data.
I want to use some of the data they published from Civio to see if I learn more about personal identifiable information fines.
fines <- read.csv("~/Downloads/multas-aepd.csv", stringsAsFactors = FALSE)
fines$date <- as.Date(fines$date)
library("ggplot2")
library("scales")
library("forcats")
ggplot(fines) +
geom_point(aes(date, amount, col = fct_relevel(sanction_type, c("Leve", "Grave", "Muy grave")))) +
scale_y_continuous(labels = dollar_format(suffix = "€", prefix = "")) +
# from https://stackoverflow.com/a/32265122/2886003
theme_bw() +
scale_color_manual(values = c("Leve" = "orange", "Grave" = "orangered", "Muy grave" = "red")) +
labs(x = "Year", y = "Amount", col = "Sanction type")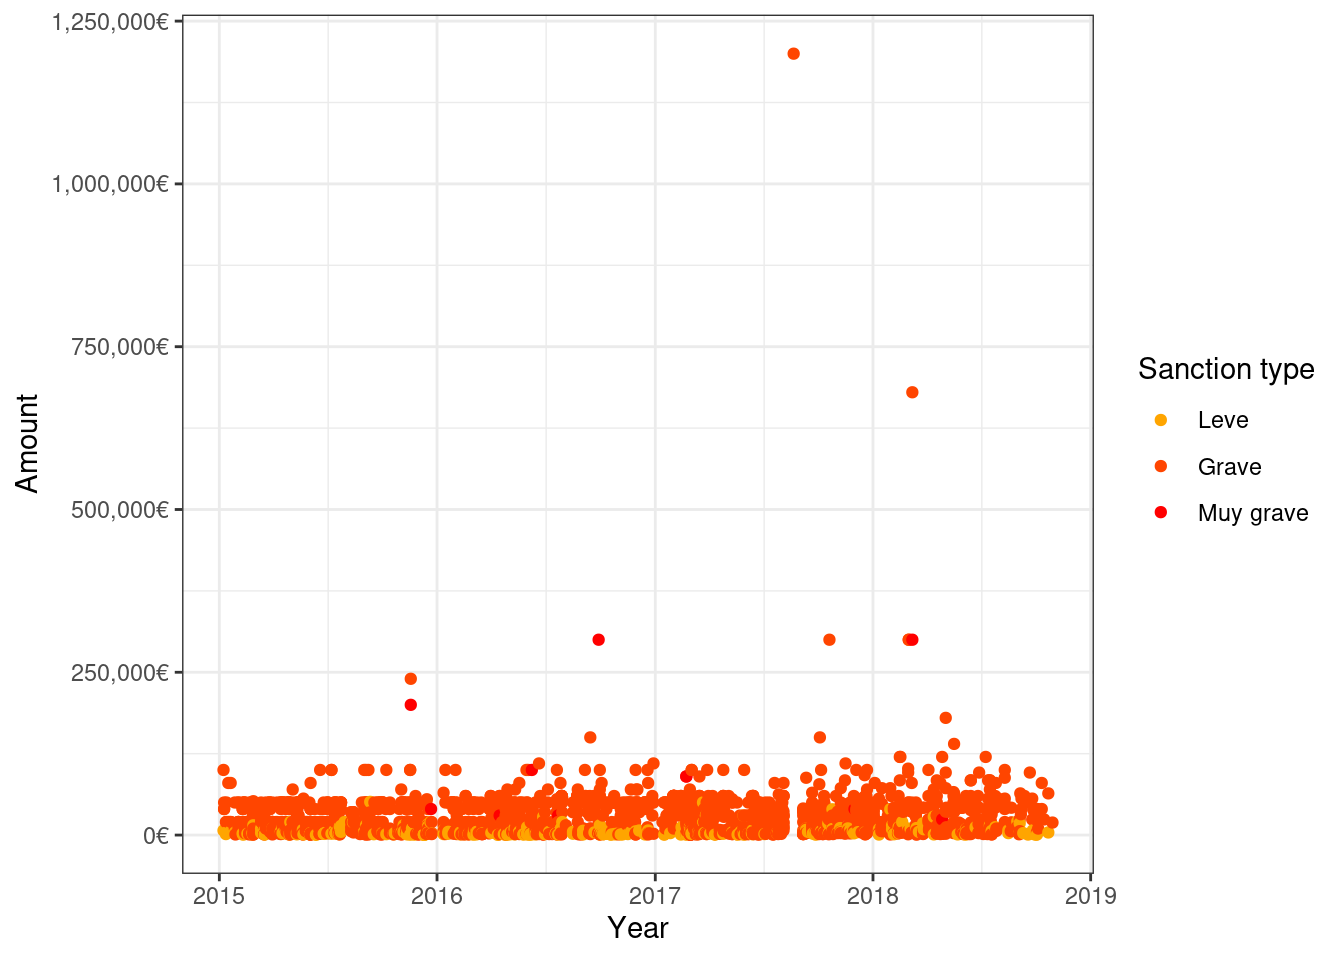
library("lubridate")
##
## Attaching package: 'lubridate'
## The following objects are masked from 'package:base':
##
##     date, intersect, setdiff, union
library("dplyr")
##
## Attaching package: 'dplyr'
## The following objects are masked from 'package:stats':
##
##     filter, lag
## The following objects are masked from 'package:base':
##
##     intersect, setdiff, setequal, union
fines %>%
  mutate(month = month(date),
         year = year(date),
         date2 = as.character(paste0(year(date), "-", month(date), "-", 1))) %>%
  group_by(date2) %>%
  count(sector) %>%
  mutate(date3 = ymd(date2)) %>%
  ggplot() +
  geom_col(aes(date3, n, fill = sector)) +
  labs(x = element_blank(), y = "Fines") +
  scale_x_date(date_breaks = "1 month", date_labels =  "%Y-%m", expand = c(0, 0)) +
  scale_y_continuous(expand = c(0, 0), breaks = seq(0, 120, by = 10)) +
  theme_bw() +
  theme(axis.text.x = element_text(angle = 45, hjust = 1))
library("dplyr")
ggplot(fines) +
  geom_histogram(aes(amount, fill = fct_relevel(sanction_type, c("Leve", "Grave", "Muy grave")))) +
  scale_fill_manual(values = c("Leve" = "orange", "Grave" = "orangered", "Muy grave" = "red")) +
  scale_x_log10(labels = dollar_format(suffix = "€", prefix = "")) +
  # from https://stackoverflow.com/a/32265122/2886003
  labs(x = "Amount", fill = "Sanction type", y = "Fines") +
  theme_bw()  +
  facet_wrap(~fct_relevel(sanction_type, c("Leve", "Grave", "Muy grave")), scales = "free")
## `stat_bin()` using `bins = 30`. Pick better value with `binwidth`.
ggplot(fines) +
  geom_histogram(aes(amount, fill = sector)) +
  scale_fill_viridis_d() +
  scale_x_log10(labels = dollar_format(suffix = "€", prefix = "")) +
  # from https://stackoverflow.com/a/32265122/2886003
  labs(x = "Amount", fill = "Sector", y = "Fines") +
  theme_bw()  +
  facet_wrap(~fct_relevel(sanction_type, c("Leve", "Grave", "Muy grave")), scales = "free")
## `stat_bin()` using `bins = 30`. Pick better value with `binwidth`.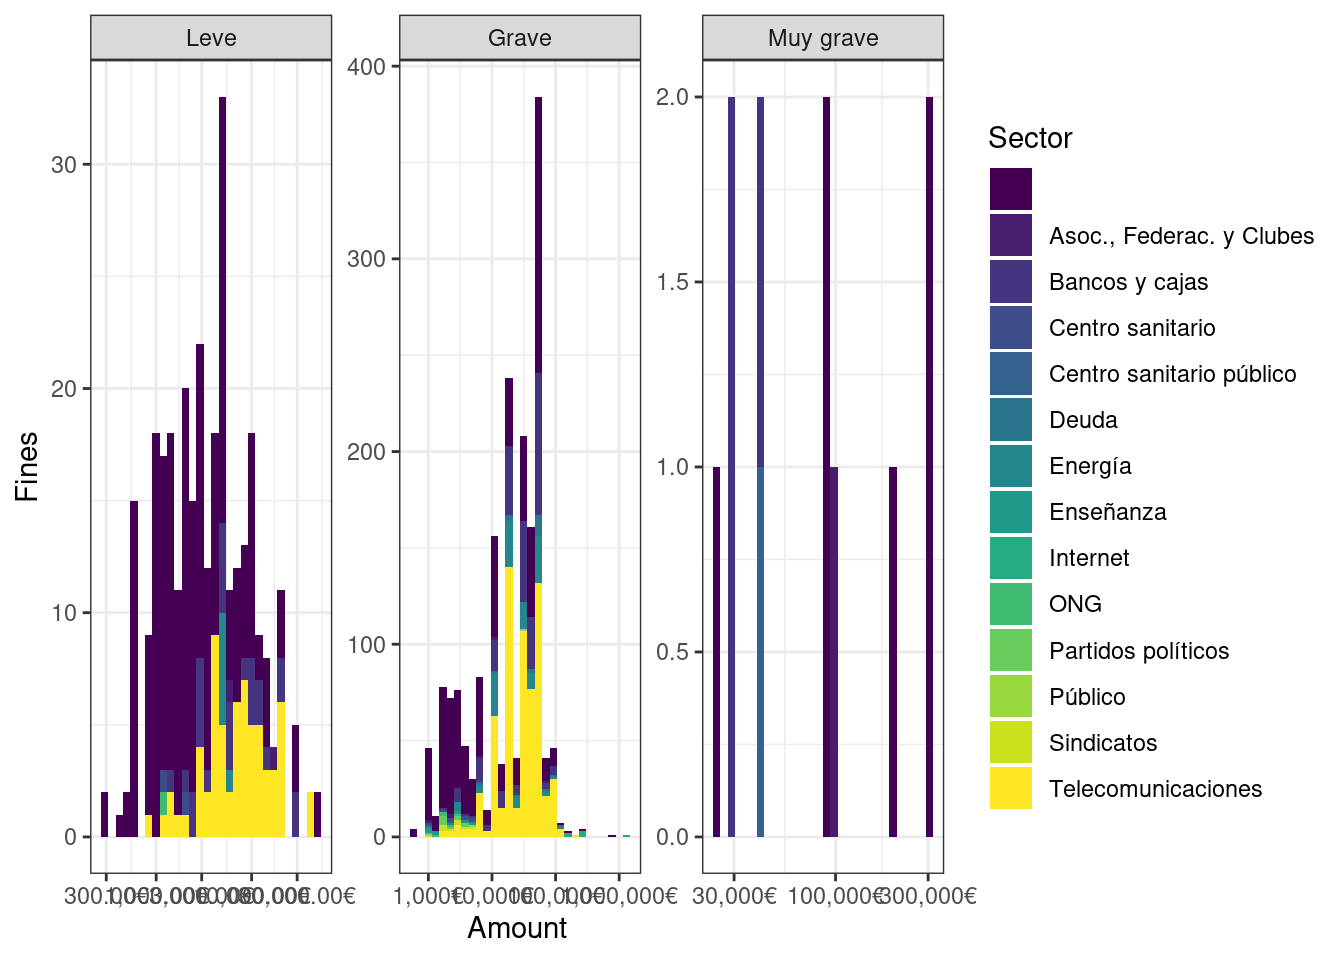
fines %>%
  filter(amount < 200000) %>%
  ggplot() +
  geom_point(aes(date, amount, col = fct_relevel(sanction_type, c("Leve", "Grave", "Muy grave")))) +
  scale_y_continuous(labels = dollar_format(suffix = "€", prefix = "")) +
  # from https://stackoverflow.com/a/32265122/2886003
  theme_bw() +
  scale_color_manual(values = c("Leve" = "orange", "Grave" = "orangered", "Muy grave" = "red")) +
  labs(x = "Year", y = "Amount", col = "Sanction type")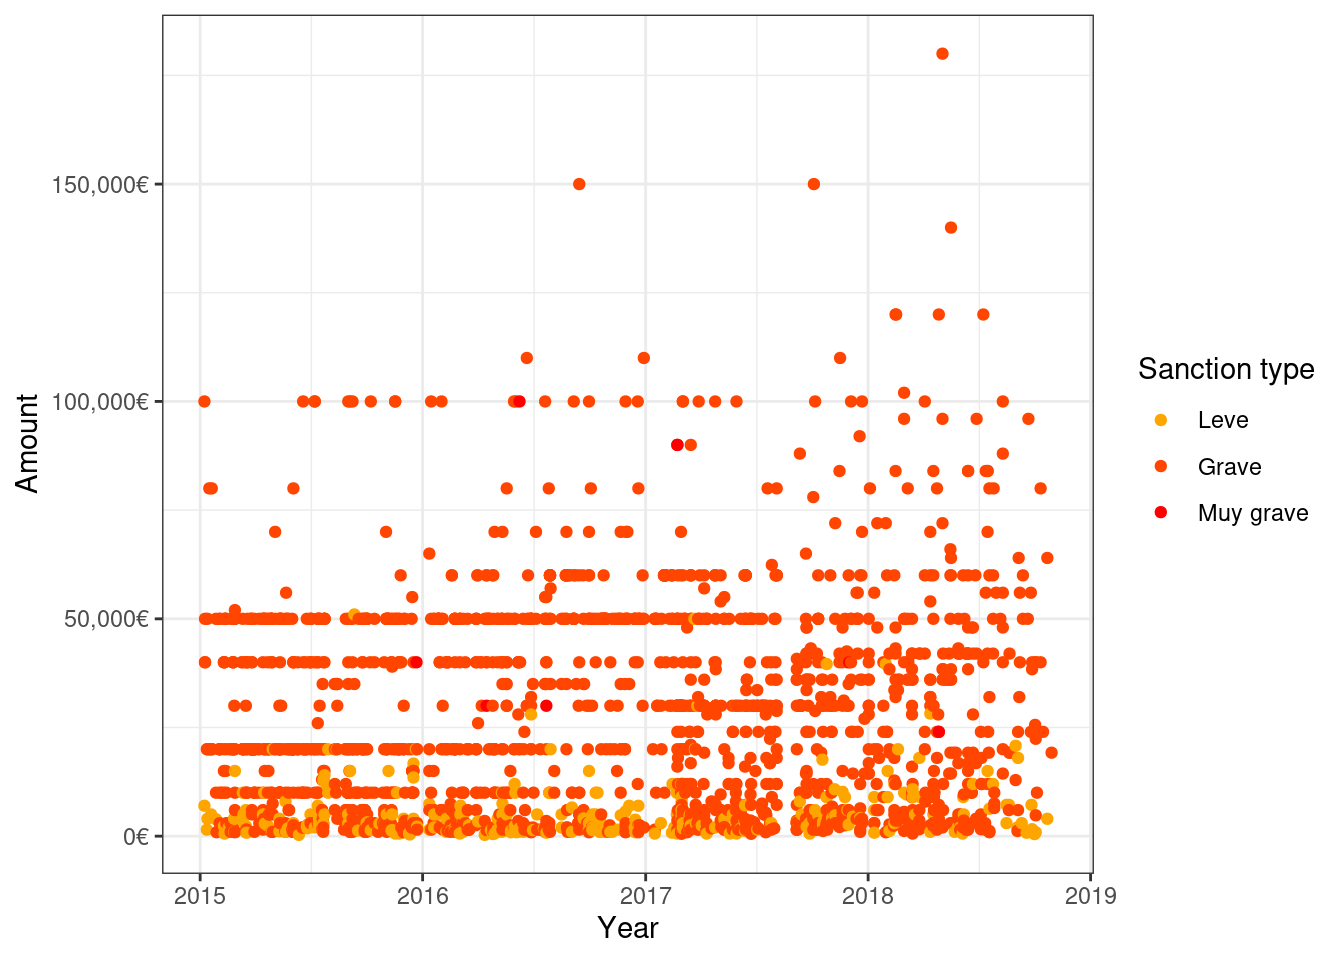
ggplot(fines) +
  geom_point(aes(date, amount, col = fct_relevel(sanction_type, c("Leve", "Grave", "Muy grave")))) +
  scale_y_continuous(labels = dollar_format(suffix = "€", prefix = ""),
                     breaks = c(1000, 4000, 10000, 20000, 40000,
                                50000, 500000, 1000000)) +
  coord_trans(y = "log10") +
  # from https://stackoverflow.com/a/32265122/2886003
  theme_bw() +
  scale_color_manual(values = c("Leve" = "orange", "Grave" = "orangered", "Muy grave" = "red")) +
  labs(x = "Year", y = "Amount", col = "Sanction type")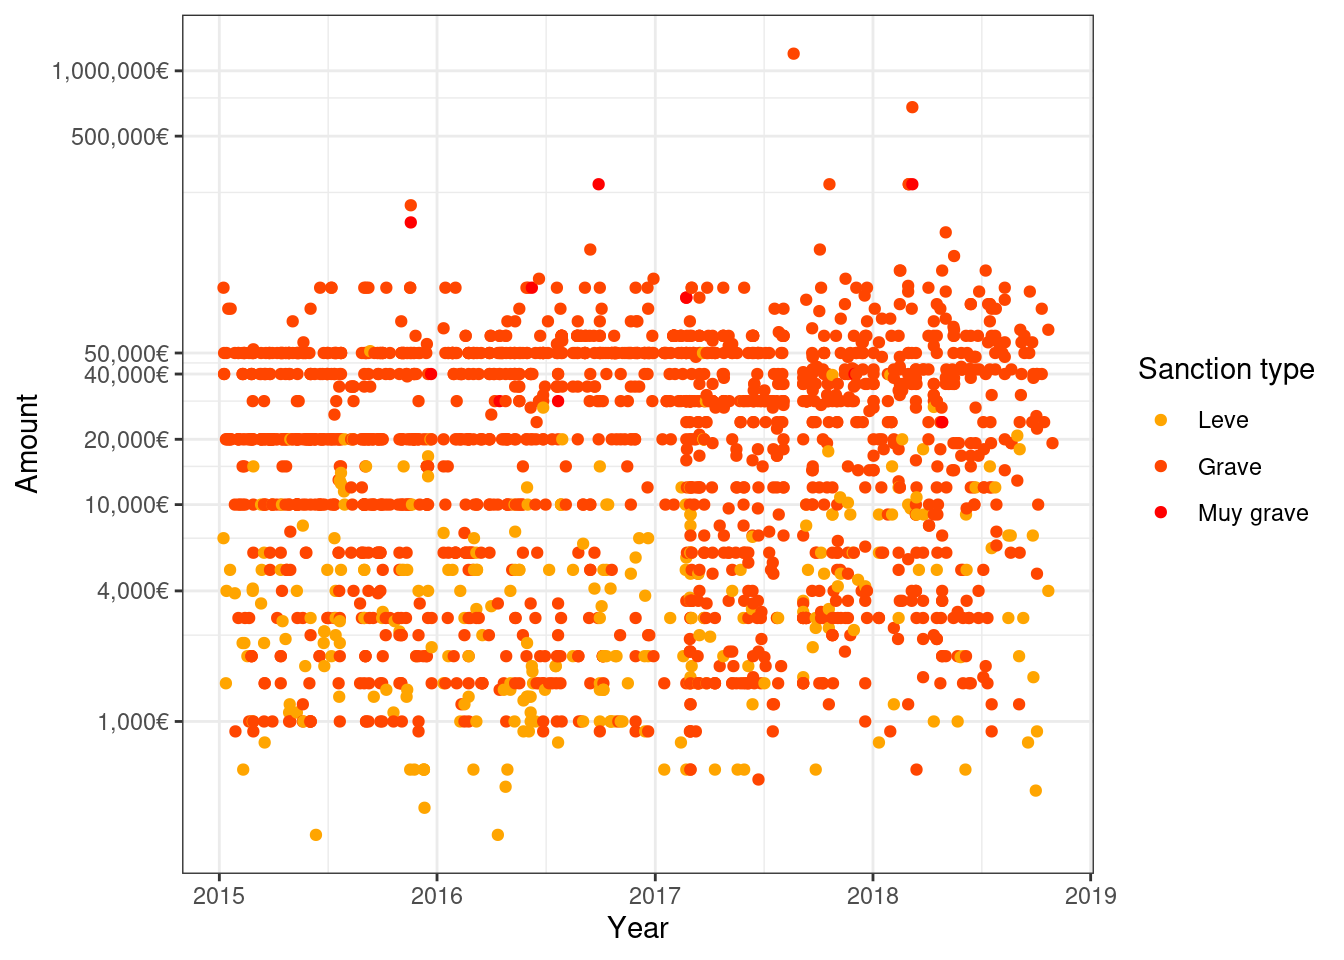
What sectors are more fined?
fines_sector <- fines %>%
  group_by(sector) %>%
  count(sort = TRUE) %>%
  ungroup() %>%
  mutate(sector = if_else(sector == "", "Unknown/unclassified", sector))
fines_sector %>%
  ggplot() +
  geom_col(aes(fct_reorder(sector, -n), n, fill = fct_reorder(sector, -n))) +
  guides(fill = FALSE) +
  labs(x = "Sector", y = "Fines") +
  # coord_trans(y = "log10") +
  theme_bw() +
  theme(axis.text.x = element_text(angle = 45, hjust = 1))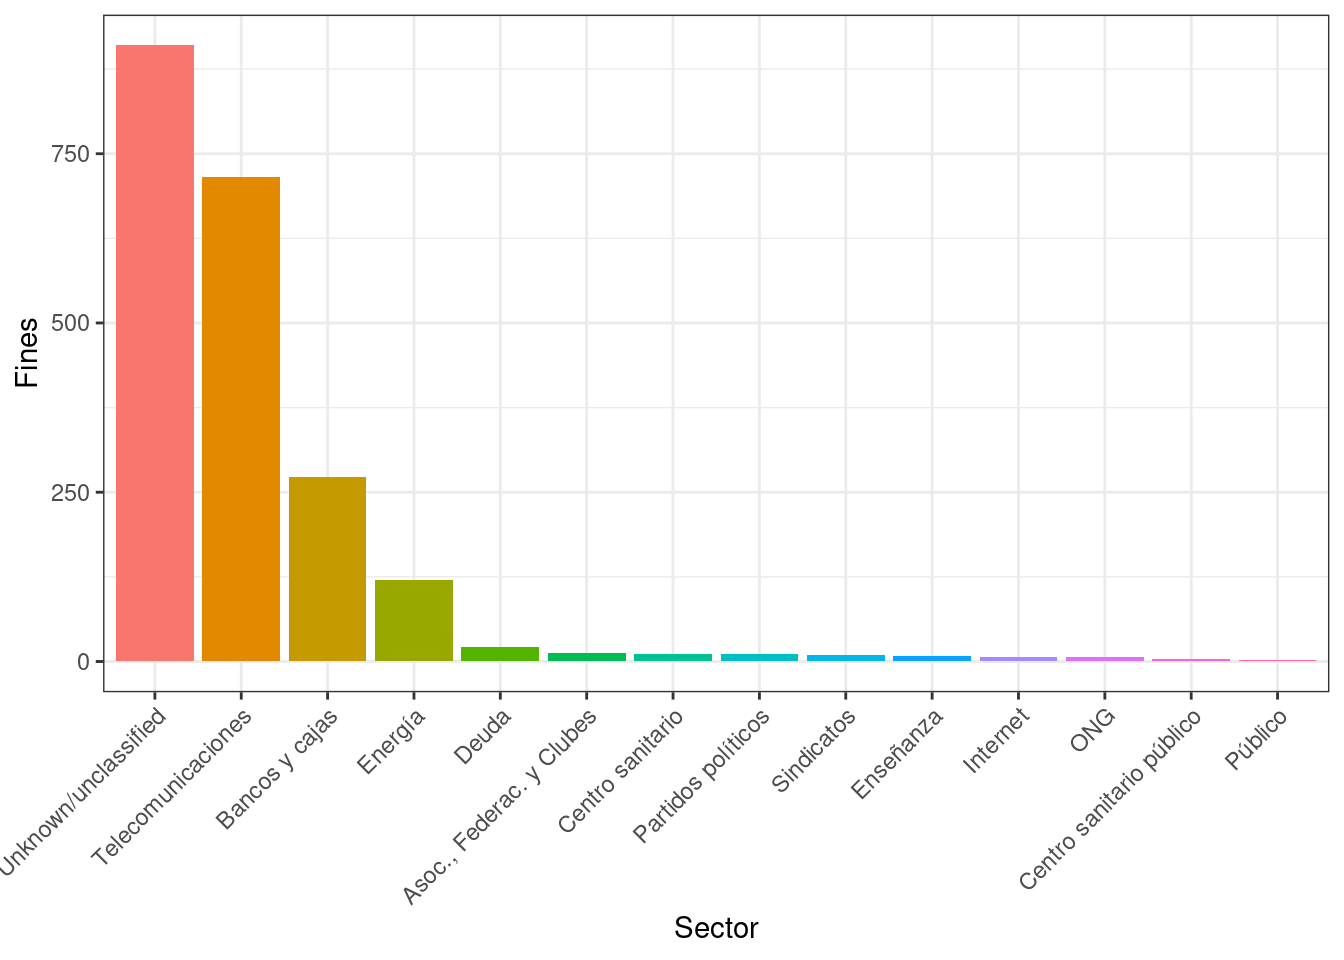
We can see that there is a white space between 2017 and 2018
fines %>%
  count(name, sort = TRUE) %>%
  arrange(-n) %>%
  ggplot() +
  geom_col(aes(fct_reorder(name, -n), n)) +
  labs(x = "Name", y = "Fines") +
  scale_y_continuous(expand = c(0, 5)) +
  # coord_trans(y = "log10") +
  theme_bw() +
  theme(axis.text.x = element_blank(), axis.line.x = element_blank(),
        axis.ticks.x = element_blank(),
        panel.grid.major.x = element_blank())
References
Reproducibility
## ─ Session info ───────────────────────────────────────────────────────────────────────────────────────────────────────
##  setting  value
##  version  R version 4.0.1 (2020-06-06)
##  os       Ubuntu 20.04.1 LTS
##  system   x86_64, linux-gnu
##  ui       X11
##  language (EN)
##  collate  en_US.UTF-8
##  ctype    en_US.UTF-8
##  tz       Europe/Madrid
##  date     2021-01-08
##
## ─ Packages ───────────────────────────────────────────────────────────────────────────────────────────────────────────
##  package       * version date       lib source
##  assertthat      0.2.1   2019-03-21 [1] CRAN (R 4.0.1)
##  blogdown        0.21.84 2021-01-07 [1] Github (rstudio/blogdown@c4fbb58)
##  bookdown        0.21    2020-10-13 [1] CRAN (R 4.0.1)
##  cli             2.2.0   2020-11-20 [1] CRAN (R 4.0.1)
##  colorspace      2.0-0   2020-11-11 [1] CRAN (R 4.0.1)
##  crayon          1.3.4   2017-09-16 [1] CRAN (R 4.0.1)
##  digest          0.6.27  2020-10-24 [1] CRAN (R 4.0.1)
##  dplyr         * 1.0.2   2020-08-18 [1] CRAN (R 4.0.1)
##  ellipsis        0.3.1   2020-05-15 [1] CRAN (R 4.0.1)
##  evaluate        0.14    2019-05-28 [1] CRAN (R 4.0.1)
##  fansi           0.4.1   2020-01-08 [1] CRAN (R 4.0.1)
##  farver          2.0.3   2020-01-16 [1] CRAN (R 4.0.1)
##  forcats       * 0.5.0   2020-03-01 [1] CRAN (R 4.0.1)
##  generics        0.1.0   2020-10-31 [1] CRAN (R 4.0.1)
##  ggplot2       * 3.3.2   2020-06-19 [1] CRAN (R 4.0.1)
##  glue            1.4.2   2020-08-27 [1] CRAN (R 4.0.1)
##  gtable          0.3.0   2019-03-25 [1] CRAN (R 4.0.1)
##  htmltools       0.5.0   2020-06-16 [1] CRAN (R 4.0.1)
##  httr            1.4.2   2020-07-20 [1] CRAN (R 4.0.1)
##  jsonlite        1.7.2   2020-12-09 [1] CRAN (R 4.0.1)
##  knitcitations * 1.0.10  2019-09-15 [1] CRAN (R 4.0.1)
##  knitr           1.30    2020-09-22 [1] CRAN (R 4.0.1)
##  labeling        0.4.2   2020-10-20 [1] CRAN (R 4.0.1)
##  lifecycle       0.2.0   2020-03-06 [1] CRAN (R 4.0.1)
##  lubridate     * 1.7.9.2 2020-11-13 [1] CRAN (R 4.0.1)
##  magrittr        2.0.1   2020-11-17 [1] CRAN (R 4.0.1)
##  munsell         0.5.0   2018-06-12 [1] CRAN (R 4.0.1)
##  pillar          1.4.7   2020-11-20 [1] CRAN (R 4.0.1)
##  pkgconfig       2.0.3   2019-09-22 [1] CRAN (R 4.0.1)
##  plyr            1.8.6   2020-03-03 [1] CRAN (R 4.0.1)
##  purrr           0.3.4   2020-04-17 [1] CRAN (R 4.0.1)
##  R6              2.5.0   2020-10-28 [1] CRAN (R 4.0.1)
##  Rcpp            1.0.5   2020-07-06 [1] CRAN (R 4.0.1)
##  RefManageR      1.3.0   2020-11-13 [1] CRAN (R 4.0.1)
##  rlang           0.4.10  2020-12-30 [1] CRAN (R 4.0.1)
##  rmarkdown       2.6     2020-12-14 [1] CRAN (R 4.0.1)
##  scales        * 1.1.1   2020-05-11 [1] CRAN (R 4.0.1)
##  sessioninfo     1.1.1   2018-11-05 [1] CRAN (R 4.0.1)
##  stringi         1.5.3   2020-09-09 [1] CRAN (R 4.0.1)
##  stringr         1.4.0   2019-02-10 [1] CRAN (R 4.0.1)
##  tibble          3.0.4   2020-10-12 [1] CRAN (R 4.0.1)
##  tidyselect      1.1.0   2020-05-11 [1] CRAN (R 4.0.1)
##  vctrs           0.3.6   2020-12-17 [1] CRAN (R 4.0.1)
##  viridisLite     0.3.0   2018-02-01 [1] CRAN (R 4.0.1)
##  withr           2.3.0   2020-09-22 [1] CRAN (R 4.0.1)
##  xfun            0.20    2021-01-06 [1] CRAN (R 4.0.1)
##  xml2            1.3.2   2020-04-23 [1] CRAN (R 4.0.1)
##  yaml            2.2.1   2020-02-01 [1] CRAN (R 4.0.1)
##
## [1] /home/lluis/bin/R/4.0.1/lib/R/library